ATRI: Trucking’s Operating Cost Hit a Record $2.336 Per Mile — and Rates Are Finally Moving
On July 15, the American Transportation Research Institute released its 2026 Analysis of the Operational Costs of Trucking, and the headline number is the highest in the report’s history: $2.336 per mile to operate a truck in 2025, up 3.4% year over year.
Strip out fuel and it’s worse. Non-fuel costs climbed 4.2% to $1.854 per mile — meaning the one line item that gave operators relief was the one they control least.
The report landed in the same month spot rates ran to some of their strongest levels in years. Those two facts together are the whole story of 2026 for owner-operators, and they cut in opposite directions.
What Went Up
Costs rose across all major line items in 2025. The biggest movers: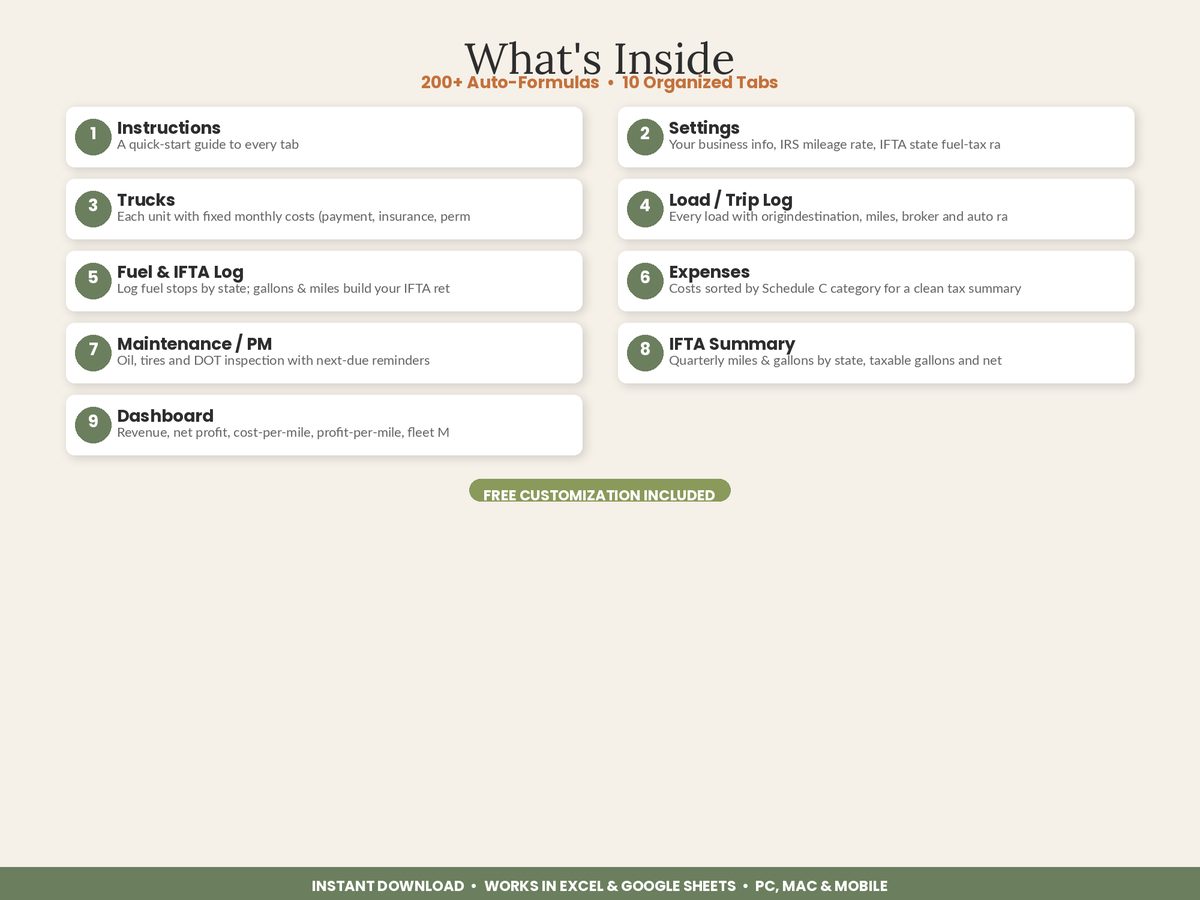
| Line item | 2025 increase |
|---|---|
| Tolls | 13.2% |
| Repair and maintenance | 8.6% |
| Driver benefits | 6.6% |
| Tires | 6.4% |
Only two categories rose at sub-inflationary rates: fuel, and — for the second consecutive year — driver pay.
There’s a pattern in that list. Tolls, maintenance, and tires are the costs that scale with miles run and equipment age, and both of those went up. ATRI reported that average truck age and annual mileage both increased while carriers deferred replacement, which is exactly the loop that drives repair costs: older trucks running more miles need more work, and the work costs more than it did.
For an owner-operator, this is not an abstraction. It’s the reason your last set of drive tires cost more than the previous set and your shop bill has been creeping.
What It Cost Carriers to Survive It
The response was austerity at a scale not seen since the downturn began. Carriers cut truck counts by 2.4% — the largest capacity reduction since the freight recession started in 2022 — and left another 10% of trucks unseated on average. Non-driver staffing was cut 7.8%. Deadhead mileage stayed elevated.
And it still wasn’t enough. Truckload and refrigerated operating margins improved slightly but stayed below 1.0%. Tank carriers averaged 4.0%. Flatbed carriers posted an average operating loss of -0.5% for the year.
A sub-1% operating margin means a single bad month — one major repair, one insurance renewal, one stretch of cheap freight — erases the year. That is not a business with room for guesswork.
The Other Half of 2026
Here’s why this report matters right now rather than as a historical footnote.
The capacity that left the market in 2025 is why rates are where they are in 2026. Early July data from FTR and Truckstop.com reported by Overdrive put the broad spot average at $3.64/mile — van at $2.99, reefer at $3.46, flatbed at $3.83 — with DAT showing posted loads up 62% year over year in the last week of June. Diesel’s national average had fallen to $4.67/gallon, roughly 97 cents off the 2026 high.
Strong rates. Falling fuel. Brokers who can’t find trucks.
As PGT Trucking COO Chad Marsilio put it in ATRI’s release: “Freight rates are finally turning a corner in 2026, but the acceleration of industry-wide costs means that fleets must continue with aggressive cost discipline.”
That’s the trap. A rising market makes cost discipline feel optional. It isn’t — because the cost base underneath the rates is structurally higher than it was two years ago, and when rates soften again the operators who used the good months to understand their numbers will be the ones who survive the next stretch.
The Number That Actually Protects You
ATRI’s $2.336 is a fleet average. It is not your number, and treating it as a benchmark you’re “beating” is a mistake — fleet figures include driver pay as an expense, which most owner-operators running their own truck don’t book the same way.
Your number is the one you calculate from your own truck payment, insurance, permits, fuel, maintenance, tires, and tolls, divided by the miles you actually ran — including deadhead. Anything else is a story you’re telling yourself.
Three things about that calculation that the ATRI data makes urgent:
It moves faster than you think. Tolls up 13%, maintenance up 8.6%, tires up 6.4%, fuel swinging a dollar a gallon inside three months. A cost per mile you worked out last winter is not the number you should be booking freight against this week.
Maintenance needs a per-mile reserve, not a monthly line. With repair costs rising 8.6% and equipment aging, a $6,000 repair booked entirely into one month distorts that month and every other one. Reserve for it per mile and your cost figure stays honest.
Deadhead is elevated industry-wide and it costs you fuel and wear at zero revenue. If your cost per mile is calculated on loaded miles only, it’s flattering you by roughly the size of your deadhead percentage.
Doing It Without Buying Software
For a single truck or a small fleet, this is spreadsheet work. Fixed costs per unit in one tab. Loads with miles, deadhead, and revenue in another. Fuel by state. Expenses categorized to Schedule C lines. A dashboard that divides.
The output is three numbers that update every time you log a load: revenue per mile, cost per mile, profit per mile. That third one is the only measure of whether the month worked.
The Trucking Owner-Operator Bookkeeping & IFTA Tracker from ReadySheetGo is built around that structure — per-unit fixed costs feeding a live dashboard, alongside the fuel and IFTA logging you have to do anyway.
The Read
ATRI’s report describes an industry that spent three years cutting everything it could cut and still ended up with margins under a point. The capacity that came out is why rates recovered. Rates recovering is why 2026 looks better than 2025.
But the cost floor didn’t come back down. It went up 3.4% and, on early 2026 data, is still climbing.
In a market with $3.64 average spot rates, plenty of operators will have a good year without ever knowing their cost per mile. That’s fine while the market holds. The ones who come out of the next soft stretch intact will be the ones who spent this one figuring out exactly what a mile costs them.
Featured on ReadySheetGo
Trucking Owner-Operator Bookkeeping & IFTA Tracker — 9 tabs built for one truck or a small fleet. Per-unit fixed cost sheet, load/trip log with automatic rate-per-mile and deadhead tracking, fuel & IFTA log by state with MPG, expense log mapped to Schedule C categories, preventive maintenance schedule with next-due odometer alerts, IFTA quarterly summary with taxable gallons and net tax owed by state, a dashboard with cost per mile and profit per mile, and a tax summary with net taxable profit. Pre-filled with sample data. Works in Excel and Google Sheets, no macros. Instant digital download — $19.99.
Sources: ATRI — New ATRI Report Details Accelerating Costs and Low Profitability Despite Cuts · Heavy Duty Trucking — Average Truck Operating Cost Reaches Record $2.336 Per Mile · Overdrive — Volumes boom, diesel fizzles
Frequently Asked Questions
What is the average cost per mile to operate a truck in 2026?
ATRI's 2026 Analysis of the Operational Costs of Trucking, released July 15, 2026, put the industry-average cost at $2.336 per mile for 2025 — 3.4% higher than the prior year and the highest per-mile figure in the report's history. Excluding fuel, costs rose 4.2% to $1.854 per mile. ATRI noted that first-quarter 2026 data show most of those cost trends continuing.
Which trucking costs rose the most in 2025?
Per ATRI, the largest percentage gains were tolls at 13.2%, repair and maintenance at 8.6%, driver benefits at 6.6%, and tires at 6.4%. Only two line items rose at sub-inflationary rates: fuel, and — for the second consecutive year — driver pay. Costs were up across all major line items.
How profitable were trucking companies in 2025?
Poor, despite significant cost cutting. ATRI reported that operating margins in the truckload and refrigerated sectors improved slightly but remained below 1.0%, tank carriers averaged 4.0%, and flatbed carriers posted an average operating loss of -0.5%. Only LTL carriers and fleets with more than 1,000 trucks had healthy margins, and those were flat year over year.
How much capacity left the trucking market in 2025?
ATRI reported the largest reduction in freight capacity since the freight recession began in 2022 — carriers cut truck counts by 2.4% and left another 10% of trucks unseated on average. Non-driver staffing was cut 7.8%, while average truck age, annual mileage, and deadhead mileage all rose.