Vending Just Hit $40 Billion and Smart Coolers Went Mainstream — Know Which Locations Earn Before You Add Formats
The numbers landed last week and they’re better than most people in this business expected.
Automatic Merchandiser’s 2026 State of the Vending and Micro Market Industry report, published July 16, puts convenience services revenue at an estimated $40.04 billion for 2025 — up 18.3% from $33.85 billion. More than 65% of surveyed operators reported revenue growth, fewer than 20% reported declines, and over 70% grew their location count.
That’s a healthy industry. It’s also an industry mid-shift, and the shift is the more interesting part of the report.
Smart Coolers Are No Longer “Emerging”
The headline finding: smart coolers accounted for 33.5% of the equipment deployed by survey respondents, nearly matching traditional glass-front vending machines. More than half of respondents now operate them, and nearly a third named them a primary operating format.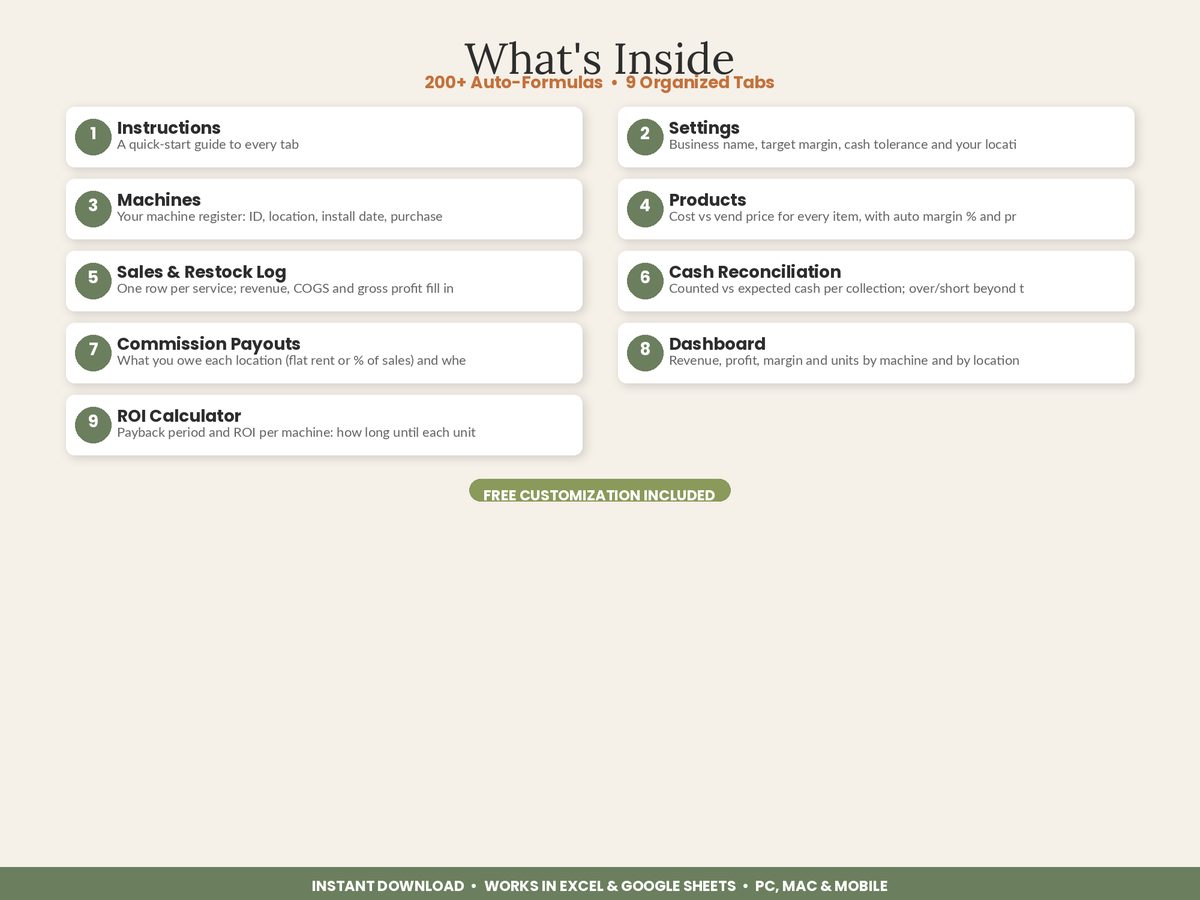
If you attended the 2026 NAMA Show in April, this won’t surprise you — the report notes smart coolers and smart stores dominated the show floor.
The logic is straightforward once you see where they fit. A smart cooler is access-controlled and charges at the point of removal, so it slots into locations that are too small for a full micro market or too exposed to shrinkage to run one safely. It’s not replacing anything. Cold beverage vending remained the largest equipment category in the survey, which tells you operators are adding formats rather than swapping them.
Micro Market Growth Is Flattening
The other side of that story: micro market expansion has cooled hard.
In 2025, 38% of respondents added micro market locations and 52.4% reported no change — against 84% reporting growth back in 2023. The category is still large and still important. It’s just no longer the default answer to “what do I put in this account?”
For context on scale, North America’s micro market segment is valued around $14.7 billion in 2026 and projected to reach $29.0 billion by 2033, per Persistence Market Research — a 10.2% CAGR. Maturing, not shrinking.
What This Means If You Run Four Machines, Not Four Hundred
It’s tempting to read a $40 billion industry number and conclude the answer is “add more.” The report actually argues something narrower: operators are becoming more selective about which format goes where.
That selectivity requires data you may not have. Choosing between another snack machine, a smart cooler, and walking away from a site comes down to three questions:
What does this location actually net me today? Not gross sales — net after cost of goods and after the location’s rent or commission. A busy site on 20% commission can easily net less than a quieter one on flat rent.
How long did my last machine at a comparable site take to pay back? If your typical payback is 18 months, a $6,000 smart cooler needs roughly double the monthly profit of a $3,000 machine to hit the same mark. That’s an arithmetic question with a real answer, not a vibe.
Where is my capital currently stuck? The machine at 17% ROI after six months isn’t losing money, which is why it never gets touched. It’s also holding the cash that should be funding the format upgrade at your best account.
The Shrink Line Is a Measurement Problem
The report’s loss-prevention section is worth flagging for small operators specifically. Nearly two-thirds reported shrink below 5%; 12.5% reported shrink above 10%. Cameras tied to monitoring services led the deterrent list, followed by visible camera feeds and signage — and regular inventory audits were named as a key tool for identifying and measuring losses.
The distinction matters. Cameras deter. Audits and cash reconciliation measure. On a route grossing $2,000 a month, the gap between 5% and 10% shrink is $1,200 a year — most of a machine. You cannot tell which side of that line you’re on without counting expected against actual, per machine, per collection.
The Boring Prerequisite to Any Expansion
Every strategic move in this report — add a smart cooler, upgrade an account to a market, drop a weak site — depends on knowing your per-location economics cold. Operators who expand off gross collections tend to replicate their worst-performing site, because gross collections don’t tell you what the commission rate is doing to your take.
The Vending Machine Business Tracker from ReadySheetGo is built for exactly that decision: a machine register with purchase cost and commission terms, a sales log that computes revenue, COGS and gross profit per service visit, a dashboard ranking every machine and location by profit and margin, and an ROI calculator showing payback months per unit. When the next format question comes up, you answer it from a table instead of a feeling.
The Takeaway
An 18.3% revenue year and a mainstream third format is good news for anyone in unattended retail. The operators who’ll capture it are the ones who can already say, without checking, which of their locations earns most per dollar deployed — and which one has been quietly holding their expansion capital hostage since last fall.
Featured on ReadySheetGo
Vending Machine Business Tracker — 9 tabs for new and scaling vending operators. Machine register with purchase cost and commission terms, product sheet with auto margin % and profit-per-unit flags, sales & restock log where revenue and COGS fill in automatically, cash reconciliation with over/short alerts, commission payout tracker for flat rent or % of sales, a dashboard ranking machines and locations by profit and margin, and an ROI Calculator with payback months per unit. Pre-filled with sample data. Works in Excel and Google Sheets, no macros. Instant digital download — $13.99.
Sources: Automatic Merchandiser — State of the Industry 2026 · Persistence Market Research — North America Micro Market
Frequently Asked Questions
How big is the vending and convenience services industry in 2026?
Automatic Merchandiser's 2026 State of the Vending and Micro Market Industry report estimates industry revenue reached $40.04 billion in 2025, an 18.3% increase over the prior year's $33.85 billion. More than 65% of surveyed operators reported revenue growth and over 70% increased the number of locations they served.
Are micro markets still growing in 2026?
Growth has slowed sharply. In 2025, 38% of surveyed operators reported adding micro market locations while 52.4% reported no change — compared with 84% reporting growth in 2023. Micro markets remain a major format, but operators are increasingly choosing smart coolers for sites too small or too shrink-prone to support an open market.
What is a smart cooler and why are operators adding them?
A smart cooler is a secure, access-controlled unattended unit that tracks purchases at the point of removal — functioning like a high-tech vending machine with a market-like presentation. In the 2026 report they accounted for 33.5% of respondents' deployed equipment, nearly matching traditional glass-front vending machines, and their access control helps explain lower reported shrink versus open micro markets.
How much shrink do vending and micro market operators report?
Nearly two-thirds of respondents to the 2026 State of the Industry survey reported shrink below 5%, while 12.5% reported shrink above 10%. Cameras connected to monitoring services were the most commonly cited deterrent, with regular inventory audits named as a key tool for identifying and measuring losses.