Food Truck Profit Tracker Spreadsheet: What a Season Actually Keeps
You worked every weekend from April to November. The window was busy. Some days you sold out. The season took $107,450.
Then February arrives and the account is nearly empty, and the only explanation anyone offers is “food trucks are hard.”
Full walkthrough of the template used in this guide.
They are not that hard. They are just measured wrong. Here is the same season, costed properly.
| Layer | Amount |
|---|---|
| Gross sales, 63 events | $107,450 |
| Profit made at the events | $37,369 |
| Overheads that ran all season regardless | −$30,527 |
| Actually kept | $6,842 |
Event margin: 34.8%. True margin: 6.4%. Same truck, same season, same money — two answers that are five times apart.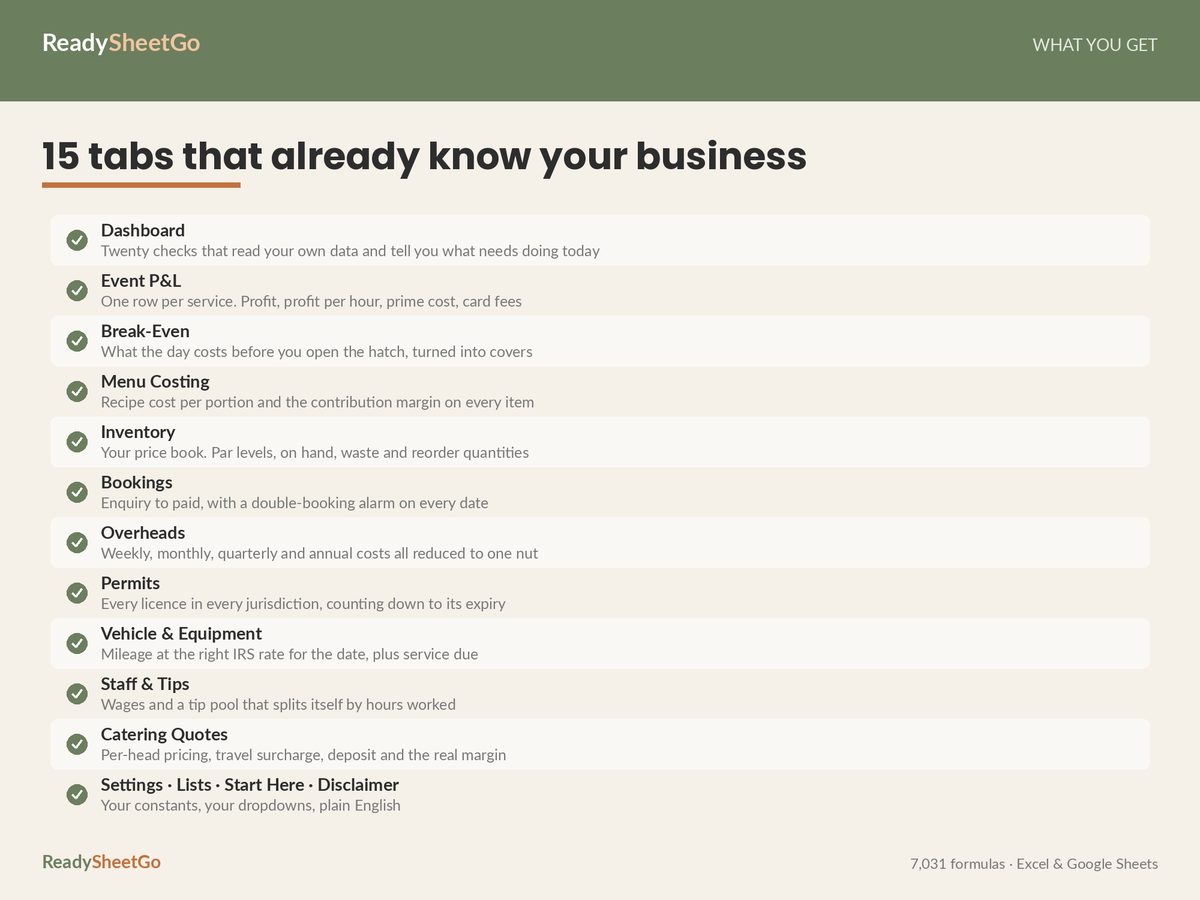
Every figure on this page comes from one fully worked eight-month season, sample data pre-filled in the tracker described at the end. The point is not the specific dollars. It is the four places the money goes that nobody logs on the day.
The First Number: Event Profit Is Not Profit
An event feels finished when the window closes and the till balances. So the mental accounting stops there: sales minus food, and the difference feels like the day’s wage.
Here is a real event from that season.
Riverfront Food Truck Rally — the biggest day of the year.
| Line | Amount |
|---|---|
| Gross sales | $4,620 |
| Food cost | −$1,418 |
| Crew — two people | −$720 |
| Fuel and travel | −$96 |
| Pitch fee | −$750 |
| Card processing on the card share | −$150 |
| Event net profit | $1,486 |
| Hours consumed (travel, setup, service, breakdown) | 8 |
| Profit per hour | $186 |
That is a good day. It is also the day that convinces an operator the business is working, because $4,620 is the biggest number they will see all year, and $1,486 into the account feels decisive.
It is not what the day kept. Ranged against it is a monthly nut of $3,759 — truck or trailer payment, commissary rent, insurance, permits, licences, phone, POS subscription, storage — which came out whether the rally happened or not. Across eight trading months that is $30,527, and it has to be paid out of the $37,369 that all 63 events made between them.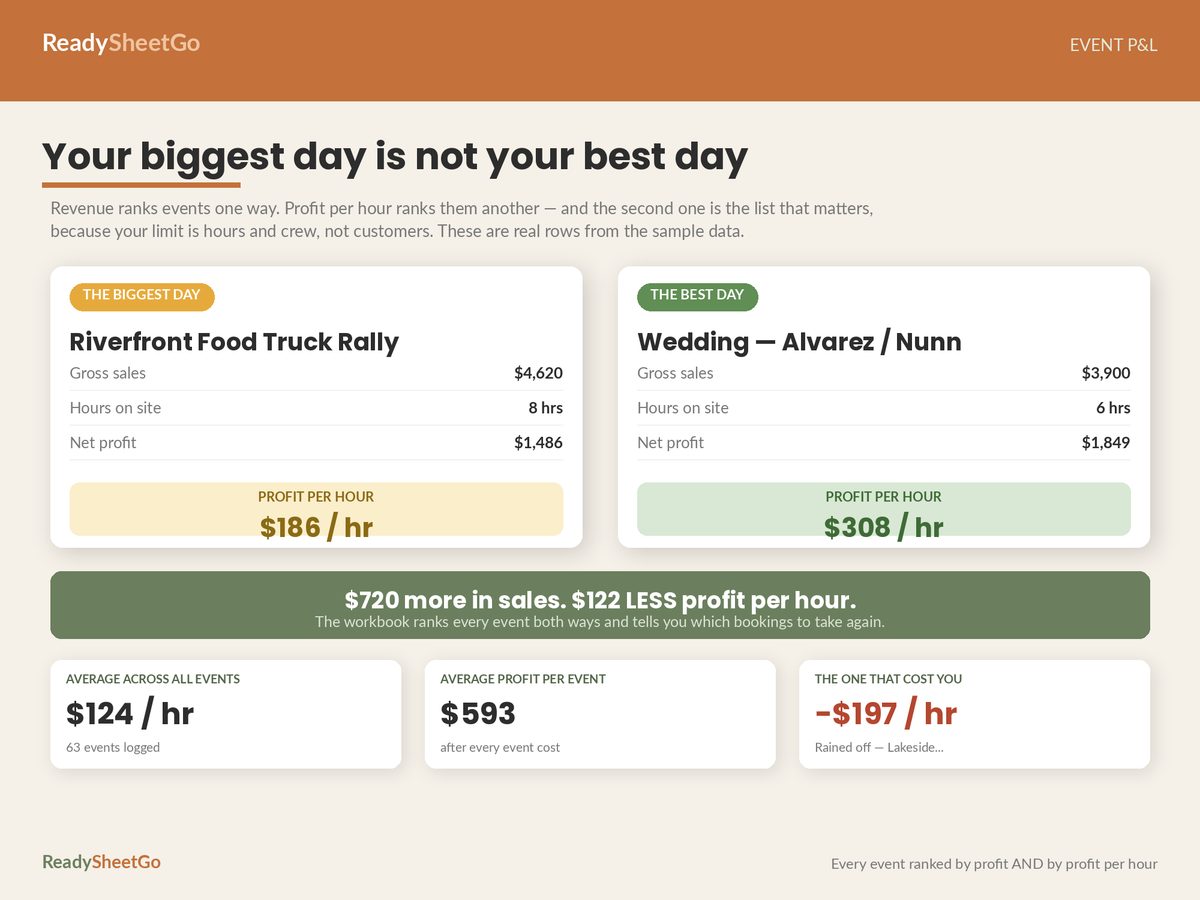
$37,369 − $30,527 = $6,842.
That is the number. It is the one nobody computes on the day, because on the day there is nothing to compute it from.
The Second Number: Profit Per Hour, Not Profit Per Event
Rank that season’s bookings by gross sales and one list comes out. Rank them by profit per hour and a different list comes out — and the second one is the one that should decide next season’s calendar.
| Event | Sales | Hours | Net profit | Profit/hour |
|---|---|---|---|---|
| Riverfront Food Truck Rally | $4,620 | 8 | $1,486 | $186 |
| Wedding — Alvarez / Nunn | $3,900 | 6 | $1,849 | $308 |
| Rained off — Lakeside Fair | — | 3 | −$590 | −$197 |
The wedding took $720 less and made $363 more, in two fewer hours. It paid 66% better per hour than the biggest day of the year, and everybody was home by nine.
That happens because a public event and a private booking have different cost shapes. The rally charges a pitch fee and hands you footfall you have to convert one $14.90 ticket at a time. The private booking has a guaranteed head count, no pitch fee, a deposit taken in advance, and a menu you costed before you agreed the price. Pricing a catering or wedding booking per head is a different calculation from a festival day, and it is usually the one that wins.
Across the whole season the averages were $593 profit per event and $124 per hour. Look at the table again and notice that the biggest day of the year was only marginally better than average per hour, and the wedding was two and a half times it.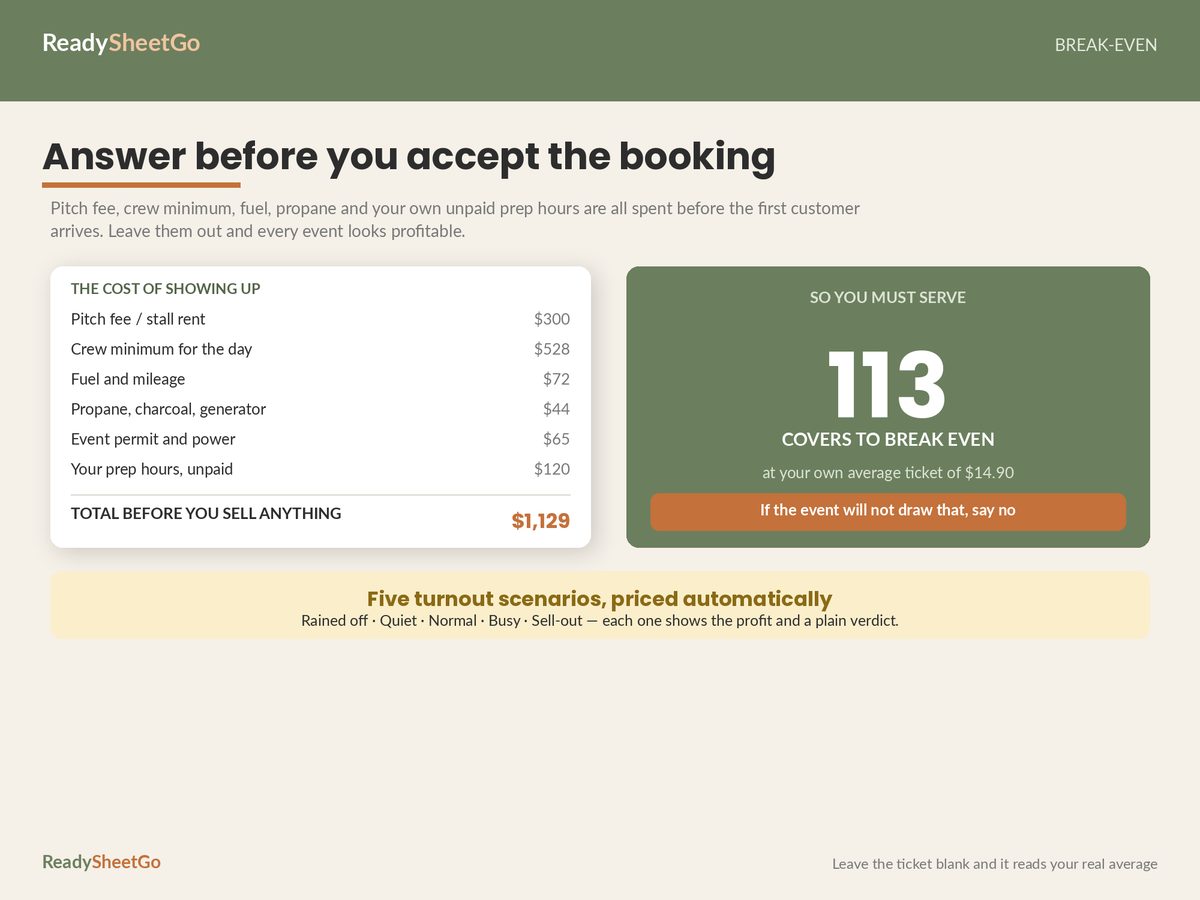
Hours are the binding constraint in a food business. Customers are not. Any tracker that ranks your season by revenue is ranking it by the wrong column.
The Third Number: Covers to Break Even
The rained-off Lakeside Fair lost $590 and consumed three hours doing it. Nothing went wrong — the truck drove out, set up, and the weather kept people away. The pitch fee, the crew, the fuel and the prepped food were all spent before the first customer did not arrive.
That is what a fixed cost is. In this season it averaged $1,129 per event:
| Fixed cost attached to one event | Approx. |
|---|---|
| Pitch or booth fee, crew rostered, fuel and travel | ~$589 |
| That event’s share of the $3,759 monthly nut | ~$540 |
| Fixed before the window opens | ~$1,129 |
Every cover sold contributes about $10.00 toward that — a $14.90 average ticket less roughly $4.90 of food and card cost. So:
$1,129 ÷ $10.00 = 113 covers to break even
And here is the finding that explains the whole season in one line. Across 63 events the truck served an average of 114 covers per event.
One cover above break-even. That is the entire year: a busy, competent, sold-out-some-days operation running a single sandwich per event above the line, which is exactly what a 6.4% true margin looks like from the inside.
Nobody could have felt that. It only appears when the fixed cost per event is written down. Work out the full break-even, including what a percentage-of-gross pitch fee does to it, and the shape of the problem changes.
The Fourth Number: Prime Cost
Prime cost is food plus labour, as a percentage of sales. It is the one restaurant metric that transfers to a truck without modification, because it is the majority of every controllable dollar you spend.
| Component | This season |
|---|---|
| Food cost | 30.7% |
| Labour | 23.0% |
| Prime cost | 53.7% |
Prime cost in the low fifties leaves enough to cover the nut. In the sixties, a truck is working hard on someone else’s behalf and will not find that out until the season ends.
The two levers are not equal, and the difference matters:
- Food cost moves with pricing and portioning, and it moves fast. Repricing one item changes it next weekend.
- Labour moves with rostering and event selection, and it moves slowly. A third crew member on a slow pitch is a decision you make once and pay for all day.
In this season, waste alone was $3,349 — 10.2% of everything spent on food. Prepping for a rally and serving a rainy Tuesday’s worth of customers is where that number is made. It does not appear on a bank statement as “waste.” It appears as food cost, quietly, and it looks like normal.
Neither lever is reachable without item-level costing. Setting menu prices from your real food cost percentage means doing the arithmetic plate by plate.
What the Menu Was Actually Doing
Costing 18 menu items in that season produced two facts that no operator has in their head:
| Item | Gross profit per unit |
|---|---|
| Brisket Combo | $13.02 |
| Bottled Water | $1.65 |
And separately, the item that contributed the most money across the whole season was not the brisket. It was the Pulled Pork Sandwich, at $10,348 of gross profit — because contribution is margin multiplied by volume, and the highest-margin item is very rarely the one that pays for the truck.
This is why “push the high-margin items” is incomplete advice. The question is which item, multiplied by how many you can realistically sell in a six-hour service window, throws off the most money — and that is a spreadsheet question, not an instinct.
Setting It Up Without Reconstructing Last Season
You do not need history. Start where you are.
- Write down the monthly nut. Truck or trailer payment, commissary rent, insurance, permits and licences, phone, POS, storage, accountant. One column, one total. Fifteen minutes, and it is the number the whole system hangs on.
- Log the next event completely — sales, food, crew, fuel, pitch fee, card fees, and the hours it really consumed, door to door. Not the service window. The hours.
- Cost five menu items from their ingredients. Start with your best seller and your two cheapest lines; the cheap lines are usually where the surprise is.
- Divide the nut by the events you expect that month and add it to each event’s fixed cost. Now you have a break-even in covers, and every booking can be judged before you accept it.
- After ten events, sort by profit per hour. That column is next season’s calendar.
There is one more discipline worth building in from the start: log mileage. A truck that drives to events accrues a deductible business mile every time, and the workbook holds two separate rates for 2026 because the standard mileage rate changed part-way through the year — check the current figure with the IRS or your accountant before you file, and keep the log either way. Miles you did not write down are worth nothing at tax time.
If you have not bought the truck yet, do the arithmetic in the other order: work out what it actually costs to start a food truck, including the six line items most startup budgets leave out.
The Thing Worth Remembering
A food truck season generates two completely different profit figures, and the flattering one is the one you see every weekend.
Event profit tells you the booking was worth doing. True profit tells you whether the business is. The distance between them is your monthly nut, and until it is written down and divided across the events that have to pay it, every good day feels like progress and February arrives as a shock.
Write the nut down. Cost one event properly. The rest follows.
Featured on ReadySheetGo
Food Truck & Mobile Food Business Profit, Event & Inventory Tracker — $18.99
Fifteen linked tabs and 7,031 working formulas — the season above, pre-filled across 63 events so you can see it working before you type a thing.
Settings holds your truck name, commissary rent, insurance, truck or trailer payment, permits, card processing rate and target food cost percentage, and drives everything else. The Event Log takes date, event, type, hours, gross sales, pitch fee, food cost, crew cost and fuel, and returns net profit, profit per hour and margin on that single line — so the $4,620 rally and the $3,900 wedding sort themselves into the right order automatically. Menu & Item Costing builds each item from its ingredients and returns cost per portion, gross profit and the margin you are actually running, flagging anything priced below target. The Break-Even Calculator turns your fixed monthly nut into covers per event.
Then: a Card Fees tab that deducts processing on every event; an Overheads tab for the nut that runs whether you trade or not; an Inventory & Waste tracker across 34 lines that values stock and returns waste as a percentage of food cost; a Crew Log with hours and labour percentage; a Catering & Quote builder that returns a per-head price still hitting your margin after the service fee; a Mileage log with separate rates for each half of the year; and a Dashboard returning revenue, event profit, true profit after overheads and fees, food cost %, labour %, prime cost, average ticket, average profit per hour, best and worst events, plus 18 checks that read your own data and tell you what needs fixing today.
Works in Excel and Google Sheets. No macros, no add-ons.
Get the Food Truck & Mobile Food Business Tracker →
Frequently Asked Questions
What profit margin should a food truck make?
There are two margins and they are wildly different. Event margin — what a booking makes after food, crew, fuel and the pitch fee — commonly runs 30-40%. True margin, after the monthly nut of truck payment, commissary rent, insurance and permits, is far thinner. In the worked season in this guide, event margin was 34.8% and true margin was 6.4% on the same $107,450 of sales. If someone quotes you a food truck margin without saying which of the two they mean, the number is not usable.
How do you calculate profit per event for a food truck?
Gross sales for that event, minus food cost, minus crew cost, minus fuel and travel, minus the pitch or booth fee, minus card processing on the card portion of the takings. That gives event net profit. Then divide it by the hours the event actually consumed — including travel, setup and breakdown, not just the service window — to get profit per hour. Profit per hour is the number that should decide which bookings you take, because hours are what you run out of, not customers.
Why does a busy food truck still run out of money?
Because event profit and kept profit are different numbers, and only the first one is visible on the day. A truck can bank $37,369 across a season of good events and still keep only $6,842, because the truck payment, commissary rent, insurance, permits and phone bill total $30,527 whether the truck trades or not. The gap is not waste — it is the monthly nut, spread across events that nobody ever assigned it to.
Do I need accounting software or is a spreadsheet enough for a food truck?
For a single truck or trailer, a spreadsheet does the job that accounting software will not: it costs a single event. Bookkeeping software tells you the business made money last month. It does not tell you that the $4,620 rally paid $186 an hour while the $3,900 wedding paid $308. That comparison needs an event-level log with hours in it, which is a spreadsheet job. Most operators run both — a spreadsheet for decisions during the season, an accountant for the return.