Candy Is Up 7% and Drinks Up 5.8% — Vending Operators Are Absorbing It in Silence
USDA’s June 2026 Food Price Outlook landed with a set of numbers that read differently depending on whether you buy snacks or sell them.
For shoppers, overall food-at-home inflation is forecast at a manageable 2.8% for 2026. Fine. Unremarkable.
For anyone stocking a vending machine, the relevant lines are the two that sit well above that:
- Sugar and sweets: +7.1% year over year as of May 2026, forecast +6.9% for the full year (prediction interval 5.2% to 8.7%)
- Nonalcoholic beverages: +5.8% year over year, forecast +5.7% for 2026
Both are running faster than their 20-year historical averages. USDA attributes the sweets increase primarily to candy and chewing gum — the subcomponent covering most chocolate — and the beverage increase in part to higher coffee prices.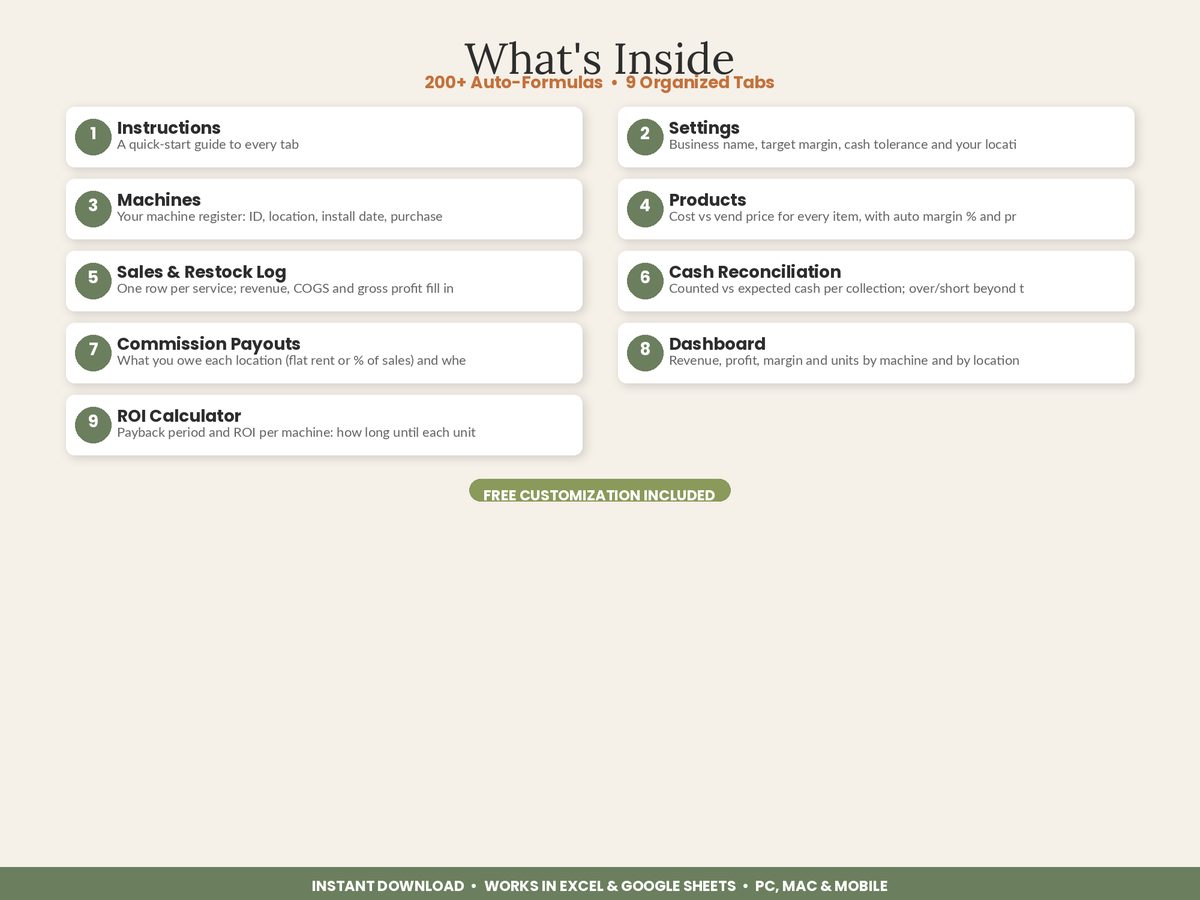
Your machines are full of exactly those two categories.
What a 7% COGS Increase Actually Does
The problem with vending is that vend prices are sticky in a way wholesale costs aren’t. Coin mechanisms, price-point psychology, and the sheer friction of walking out to reprogram every selection mean operators tend to hold prices and quietly eat the difference.
Here’s what that looks like on a single item:
| Last year | Now (+7%) | |
|---|---|---|
| Unit cost | $0.45 | $0.48 |
| Vend price | $1.25 | $1.25 |
| Profit per unit | $0.80 | $0.77 |
| Margin | 64.0% | 61.6% |
Three cents. Easy to shrug at.
Now run it across a machine selling 900 units a month: $27 a month, $324 a year, on one machine. A four-machine route is roughly $1,300 in vanished profit — with no single moment where anything obviously went wrong. Nothing broke. The bags of cash look the same. The margin just moved.
And the higher-cost items move more. A $1.10 energy drink at +7% is $1.18, which at a held $2.75 vend price drops margin from 60.0% to 57.1%. In dollar terms, your most expensive SKUs leak the fastest.
The Products Nobody Reprices
Ask an operator which of their selections is below target margin and you’ll usually get a category answer — “the drinks are getting expensive” — rather than an item answer.
Item answers are the ones you can act on. They require exactly two columns kept current per product: unit cost and vend price. Profit per unit and margin percentage compute from those, and a target margin comparison flags the losers automatically.
Do that and the response to a cost increase changes shape entirely. Instead of a vague decision about whether to “raise prices,” you get a list: these four selections dropped below 55% margin this quarter, three of them go up a quarter, one gets replaced with a different SKU at a better cost.
The Vending Machine Business Tracker from ReadySheetGo does this on its Products tab — you set a target margin once in Settings, and every product shows profit per unit, margin %, and a health flag that turns red the moment an updated unit cost pushes it under target.
Cashless Makes Repricing Less Painful
There’s a reason price increases feel scarier in vending than in most retail: a customer who has to feed in another quarter notices.
Fewer of them do now. Cantaloupe’s Micropayment Trends Report found 71% of U.S. vending transactions were cashless in 2024, up 17% year over year, with contactless making up 77% of cashless sales. The average cashless ticket ran $2.24 versus $1.78 for cash — a 37% larger basket.
A tap doesn’t have change-in-your-pocket friction. Which means the practical ceiling on your price points is higher on a card-enabled machine than it was on a coin-only one, and moving a $1.25 selection to $1.50 costs you less volume than the old intuition suggests — particularly now that cash has fallen to roughly 1 in 7 consumer payments.
Not Everything Is Going Up
Worth keeping the picture honest, because a blanket price increase is the lazy version of this. The same USDA report forecasts egg prices down 30.4% in 2026 and dairy and fats/oils declining as well. If your mix includes fresh or refrigerated items — and with smart coolers now at 33.5% of deployed industry equipment, more operators’ mixes do — some of your cost lines are moving the other way.
That’s the argument against a route-wide markup and for a per-product margin check. Some selections need a price increase. Some don’t. Some should be swapped for something with better economics at the same slot.
What To Do This Month
Update your unit costs from your last three invoices. Not estimates — the actual numbers you paid. This is the step everyone skips and it’s the only one that makes the rest meaningful.
Sort by margin, not by sales. Your best-selling item and your best-margin item are frequently not the same, and the gap tells you where the planogram is wrong.
Reprice the outliers only. Move the specific selections that fell below target to the next natural price point. Leave the rest.
Recheck in 90 days. With sweets forecast to run 5.2% to 8.7% for the year, this isn’t a one-time correction — it’s a quarterly habit.
Costs will keep moving. The operators who stay profitable through it aren’t the ones who guessed right about prices; they’re the ones who can see, in a column, exactly which items stopped working.
Featured on ReadySheetGo
Vending Machine Business Tracker — 9 tabs for new and scaling vending operators. Machine register with purchase cost and commission terms, products sheet with unit cost vs vend price, auto margin % and profit-per-unit health flags against your target, sales & restock log where revenue and COGS fill in automatically, cash reconciliation with over/short alerts, commission payout tracker, a dashboard ranking machines and locations by profit, and an ROI Calculator with payback months per unit. Pre-filled with sample data. Works in Excel and Google Sheets, no macros. Instant digital download — $13.99.
Sources: USDA ERS — Food Price Outlook, June 2026 · Cantaloupe — 2025 Micropayment Trends Report
Frequently Asked Questions
How much are snack and beverage prices rising in 2026?
USDA's June 2026 Food Price Outlook forecasts sugar and sweets prices to increase 6.9% in 2026, with a prediction interval of 5.2% to 8.7%, and nonalcoholic beverages to increase 5.7%. As of May 2026, sugar and sweets were already 7.1% higher than a year earlier and nonalcoholic beverages 5.8% higher — both growing faster than their 20-year historical averages.
Why are candy prices rising faster than other food?
USDA attributes the increase primarily to candy and chewing gum, the CPI subcomponent that includes most chocolate candy. Nonalcoholic beverage increases are driven in part by higher coffee prices. Both categories are running above their 20-year historical rates while overall food-at-home inflation is forecast at just 2.8% for 2026.
Should vending operators raise prices in 2026?
That depends on which selections are actually losing margin, which requires knowing your current margin per product. A useful order of operations is to identify products that have fallen below your target margin, raise those specific vend prices to the next natural increment rather than raising everything, and lean on cashless — Cantaloupe found the average cashless vending ticket runs $2.24 versus $1.78 for cash, so higher price points are less punishing on a card than in coins.
How do I know which vending products are losing money?
Keep unit cost and vend price in one products sheet with a formula calculating profit per unit and margin percentage, and set a target margin you compare against. When your wholesale invoice changes, update the unit cost and every affected selection reprices its margin instantly — turning a vague sense that costs are up into a specific list of items to reprice or drop.