How to Calculate Vending Machine ROI and Payback Period (Spreadsheet Method)
You bought the machine, you placed it, and money comes out of it every couple of weeks. What you probably can’t tell me is which month that machine stops being a debt and starts being an asset.
That’s the payback question, and it’s the one that separates operators who scale from operators who add machines until the cash stops adding up. It’s not a hard calculation. It’s just one nobody does consistently, because doing it by hand means digging through six months of collection notes.
Here’s the math, the inputs people get wrong, and how to make it run itself.
The Two Numbers, and Why They’re Different
ROI tells you where a machine stands right now: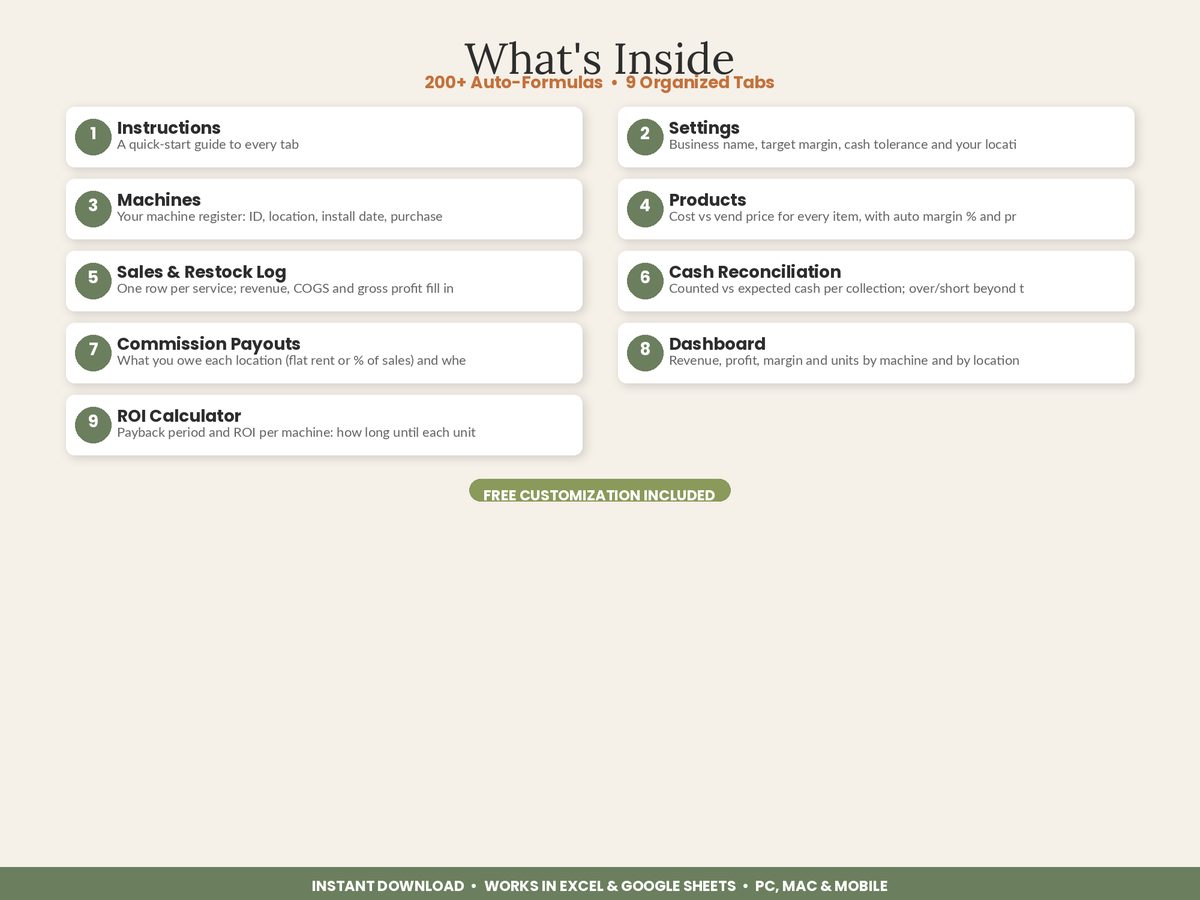
Total net profit to date ÷ Purchase cost = ROI %
Payback period tells you when it finishes:
(Purchase cost − Total profit to date) ÷ Average monthly profit = Months remaining
ROI is a scoreboard. Payback is a forecast. You need both, because a machine at 90% ROI after four years is a very different animal from a machine at 90% ROI after eleven months, and the second one tells you to go buy three more like it.
Purchase Cost: The Number Everyone Understates
The price on the machine is not the cost of the machine. What you actually spent to get that unit earning includes:
- The machine itself (new snack/combo units commonly run $2,800 to $4,500; refurbished considerably less)
- Delivery and installation
- The card reader plus activation and monthly telemetry fee
- The initial product fill — real money, often $150 to $400 sitting inside the unit
- Locks, signage, a dolly rental, whatever it took
- Any placement or finder’s fee paid to a locator
Skip the card reader and the first fill and you’ve understated the machine by $400 to $800. Every payback number you calculate after that is wrong in the flattering direction — which is exactly the direction that makes you buy the fifth machine before the first four have proven themselves.
Card readers, incidentally, are no longer optional. Cantaloupe’s Micropayment Trends Report found 71% of U.S. vending transactions were cashless in 2024, up 17% year over year, with contactless accounting for 77% of cashless sales. The average cashless ticket was $2.24 versus $1.78 for cash — a 37% higher basket. It matters most at young-skewing sites: the Fed’s 2026 payments diary found 18-to-24-year-olds make just two cash payments a month, against ten for consumers over 55. A cash-only machine is a machine with a self-imposed revenue ceiling, and that ceiling shows up directly in your payback period.
Profit, Not Revenue — And Definitely Not “Cash Collected”
This is where most vending ROI math falls apart. Three different numbers get used interchangeably and they are nowhere near each other.
Take a machine that sold $520 last month:
| Line | Amount |
|---|---|
| Revenue (gross sales) | $520.00 |
| Cost of goods sold | −$208.00 |
| Gross profit | $312.00 |
| Location commission (15% of sales) | −$78.00 |
| Net profit to you | $234.00 |
If you run your ROI off the $520, your $3,200 machine “pays back” in six months. Off the real $234, it’s fourteen months. That gap is the entire reason people wonder why the bank account doesn’t match the route.
And the commission line is not a rounding error. A flat-rent location at $75 a month and a 20% commission location on a $600 machine are $45 apart every single month — $540 a year, on one unit. That’s a sixth of a machine.
Worked Example: Four Machines, Four Very Different Stories
Say you’re a year into a small route:
| Machine | Location | Cost | Profit to date | Months owned | Avg/mo | ROI | Payback remaining |
|---|---|---|---|---|---|---|---|
| VM-001 | Downtown gym | $3,200 | $2,340 | 10 | $234 | 73% | 3.7 months |
| VM-002 | Office park | $2,800 | $1,890 | 9 | $210 | 68% | 4.3 months |
| VM-003 | Laundromat | $3,950 | $684 | 6 | $114 | 17% | 28.6 months |
| VM-004 | College hall | $3,200 | $770 | 5 | $154 | 24% | 15.8 months |
Two of those are working. VM-003 is the problem: the most expensive machine you own, in the location generating the least profit, on track to take nearly three more years to pay for itself. It’s not losing money — that’s why it never gets dealt with. It’s just consuming the capital that should be buying machine five.
Without the table, VM-003 feels fine. It produces cash every visit. Ranked next to the others, it’s obviously a relocation candidate.
The Vending Machine Business Tracker from ReadySheetGo builds this exact table automatically — its ROI Calculator tab pulls each machine’s purchase cost from the machine register and its profit from the sales log, then computes payback months, ROI %, and a paid-off status flag per unit.
The Seasonality Trap
A college machine that nets $154 a month across five months looks steady. It usually isn’t. It netted $260 in September and $12 in December, and your average is hiding a two-month hole.
Two fixes worth building in:
Use trailing 3-month average profit, not lifetime average, for the payback forecast. Lifetime average is the right basis for ROI (it’s historical fact); recent average is the right basis for prediction.
Note the season on the machine record. “Seasonal — term only” next to VM-004 turns a confusing number into an expected one, and stops you from pulling a machine in July that’s going to have a great October.
What To Do With the Answer
Payback under 18 months means the location works — the move is to ask that property manager whether they have other sites.
Payback of 18 to 30 months is normal and fine. Leave it alone and work on product margin.
Payback past 36 months is a decision, not a data point. In order of cost to you: change the product mix first (a machine full of $0.35-cost water at $1.50 behaves differently than one full of $1.10 energy drinks at $2.75), then renegotiate the commission, then relocate the unit. Relocation costs a few hundred dollars and buys back years of payback time — which is a trade almost nobody makes, because almost nobody has the number in front of them.
Making It Automatic
The reason operators don’t track this isn’t the math. It’s that every recalculation means re-adding six months of collection slips.
Set it up once so it maintains itself: a machine register holding ID, location, install date, purchase cost, and commission terms; a sales log where you add a row per service visit; and an ROI sheet that looks up cost from the register, sums profit from the log, and divides. After that, ROI and payback per machine are just something you look at, the same way you look at the fuel gauge.
That’s the difference between running a route and running a business. One of them can tell you which machine to buy next.
Featured on ReadySheetGo
Vending Machine Business Tracker — 9 tabs for new and scaling vending operators. Machine register with purchase cost and commission terms, product sheet with auto margin % and profit-per-unit flags, sales & restock log where revenue and COGS fill in automatically, cash reconciliation with over/short alerts, commission payout tracker for flat rent or % of sales, a dashboard ranking every machine and location by profit, and an ROI Calculator showing payback months and ROI % per unit. Pre-filled with sample data. Works in Excel and Google Sheets, no macros. Instant digital download — $13.99.
Sources: Cantaloupe — 2025 Micropayment Trends Report
Frequently Asked Questions
How do you calculate vending machine ROI?
Divide total profit the machine has generated to date by what you paid to put it in service, then express it as a percentage. Profit means revenue minus cost of goods sold minus the location's rent or commission — not gross sales. A machine that cost $3,200 and has returned $1,280 in net profit is at 40% ROI and is not yet paid off.
How long does it take for a vending machine to pay for itself?
Payback in months equals the remaining unrecovered cost divided by average monthly profit. A $3,200 machine netting $180 a month pays back in about 18 months; the same machine netting $95 a month takes over 33 months. Operators generally consider under 18 months strong, 18 to 30 months acceptable, and past 36 months a signal to renegotiate the location or relocate the unit.
What costs should be included in a vending machine's purchase cost?
Everything you spent to get it earning: the machine itself, delivery and installation, the card reader and its activation, the initial product fill, any lock or signage work, and a location setup or placement fee if you paid one. Leaving out the card reader and first fill typically understates true cost by $400 to $800 per machine, which makes every payback estimate too optimistic.
What is a good ROI for a vending machine?
Because ROI accumulates over time, the useful benchmark is annualized. A machine returning 40% to 70% of its purchase cost in net profit per year is performing well; under 25% annually means the location, the product mix, or the commission rate needs to change. Industry-wide, a typical U.S. machine in a decent location grosses roughly $300 to $1,500 a month, and net profit is a fraction of that after COGS and commissions.