How to Track Dividend Income and Yield on Cost in a Spreadsheet
Your brokerage app will tell you a position yields 3.4%. What it almost never tells you is that you are getting 3.7%, because you bought it cheaper than today’s buyer — or that across everything you own, next year’s dividend income is on track to be $721 without you doing anything at all.
Those two numbers are the reason dividend investors keep a spreadsheet. Both are trivial arithmetic. Neither survives being spread across three brokerage accounts, and one of them is quietly broken in most templates.
The Four Columns That Do Everything
Everything below comes out of four inputs per position: shares held, cost per share, the dividend payment you received, and the payment date. Nothing else.
From those, three formulas: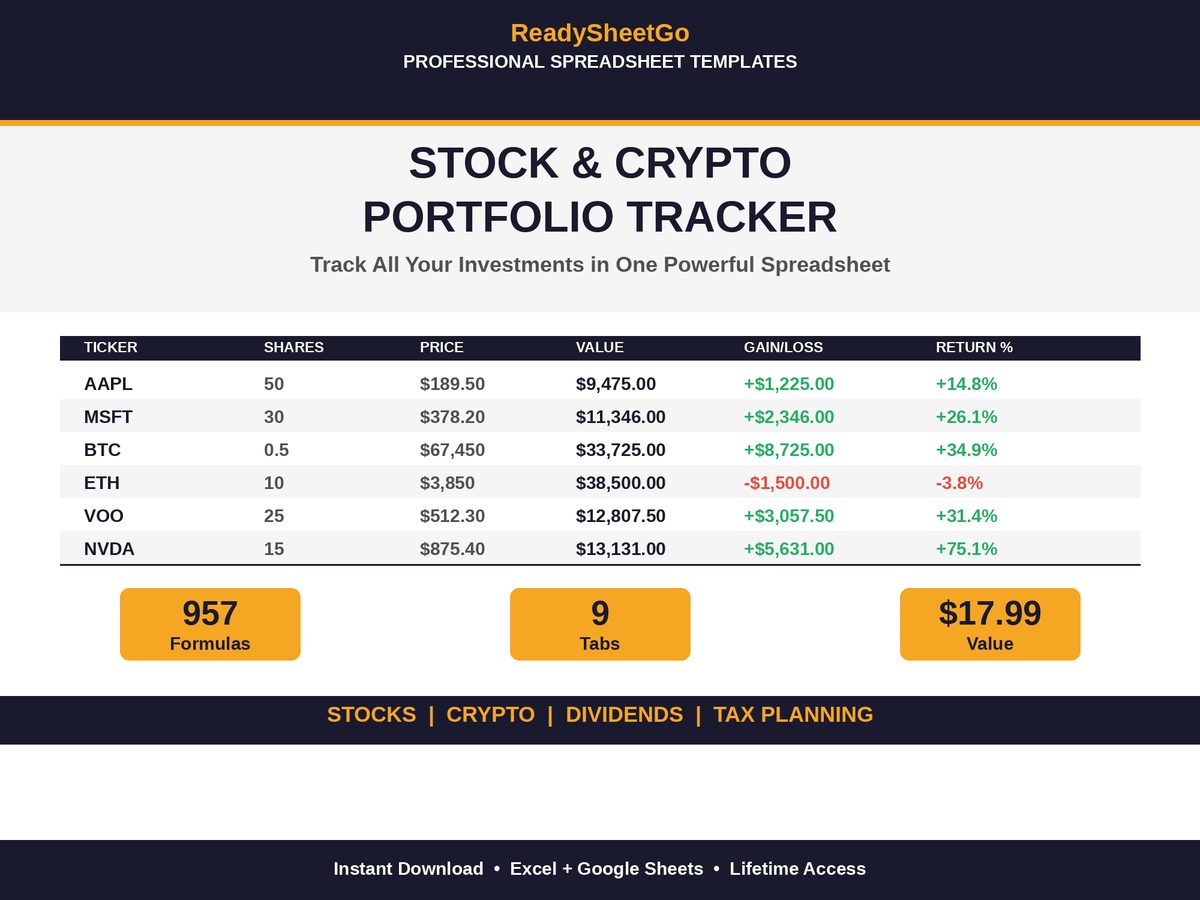
Dividend per share    = Dividend received / Shares held
Annual projected      = Dividend per share × payments per year
Yield on cost         = Annual projected / Cost per share
Add a current price column and you get the fourth, current yield, which is the same annual figure divided by today’s price instead of yours.
The Worked Example
Five income-paying positions from the worked portfolio in the main guide. Dividend rates below are illustrative assumptions chosen to make the arithmetic legible, not forecasts.
| Position | Shares | Cost/share | Per-share annual | Annual income | Yield on cost | Current yield |
|---|---|---|---|---|---|---|
| SCHD | 120 | $27.40 | $1.012 | $121.44 | 3.69% | 3.39% |
| O | 90 | $56.20 | $3.222 | $289.98 | 5.73% | 5.55% |
| VTI | 40 | $248.00 | $3.60 | $144.00 | 1.45% | 1.24% |
| VXUS | 60 | $63.80 | $2.10 | $126.00 | 3.29% | 3.07% |
| MSFT | 12 | $412.50 | $3.32 | $39.84 | 0.80% | 0.73% |
| Total | $721.26 | 2.49% | 2.24% |
Portfolio yield on cost is total projected income divided by total cost basis: $721.26 / $28,964.00 = 2.49%. Current yield is the same income over current value: $721.26 / $32,139.00 = 2.24%.
Read those two side by side and you learn something the app’s single yield figure hides. The 2.24% is what this portfolio would yield to somebody buying it today. The 2.49% is what it yields to the person who actually bought it. The gap exists because the portfolio went up; it widens every year prices rise and dividends get raised, and it’s the closest thing to a scoreboard a long-term income investor has.
Note the shape of the table too. Realty Income is 16.3% of the stock portfolio by value and 40.2% of the income. SCHD is 11.1% of value and 16.8% of income. MSFT is 17.0% of value and 5.5% of income. That concentration is invisible in a pie chart of holdings and obvious the moment you total an income column — and if you’re relying on the income, it’s the more relevant chart.
The Monthly-Payer Trap
Here’s the bug worth knowing about, because it’s in a great many dividend templates including the one we sell, and it silently reports a third of the truth.
The standard annualisation formula is = Dividend received × 4. It assumes every payer is quarterly. Most US companies are, so it’s a reasonable default — until you hold one that isn’t.
Realty Income pays monthly. On the assumptions above, that’s $0.2685 per share, and on 90 shares that’s $24.17 a month. Log that single payment and the ×4 turns it into $96.68 a year. The real figure is $24.17 × 12 = $290.04. The tracker just told you your largest income position pays a third of what it pays, and your portfolio yield on cost drops from 2.49% to 1.82% for no reason at all.
Two fixes, both fine:
The one-column fix. Add a Payments per year column, put 12 for monthly payers, 4 for quarterly, 2 for semi-annual, 1 for annual, and change the formula to = Dividend per share × Payments per year. This is the correct fix and takes about ninety seconds.
The no-change fix. Log a full quarter as one row — three monthly payments summed into the Dividend Received cell — and the ×4 becomes accurate again. $24.17 × 3 = $72.51 in the cell; $72.51 × 4 = $290.04. Slightly cruder, but it needs no formula edit and it also smooths out the variable payers.
The same trap catches anyone holding UK or European names that pay semi-annually, where the ×4 doubles the income instead of thirding it. If a position’s projected income looks wrong, the payment frequency is where to look first.
Log Payments, Not Just Rates
There’s a temptation to skip the payment log entirely and just type each holding’s advertised annual rate into a cell. Don’t. The rate is a claim; the payments are what happened.
A per-payment log — ticker, ex-dividend date, payment date, amount received — gives you four things a static rate can’t:
- Actual received, net of anything withheld. Foreign withholding on international positions can knock 15% off a payment that the advertised yield never mentioned.
- A raise, visible the month it happens. A payment that goes from $30.36 to $32.05 is a 5.6% raise, and it flows straight through to your yield on cost.
- A cut, visible the month it happens. Rather than the following February, when the total comes in short and you can’t tell which position did it.
- A tax-time total that already agrees with your 1099-DIV, or flags that it doesn’t.
The ex-dividend date column earns its place too: it’s the date that determines who gets the payment, and it’s the date the holding-period test for qualified-dividend treatment revolves around. You don’t need to do anything clever with it, you just need to have written it down.
The Number That Makes This Worth Doing
Project the annual income column forward and the portfolio above generates $721.26 next year on money already invested. Add nothing, sell nothing, and assume a modest 5% average raise across the payers, and that’s $757 the year after, $795 the year after that.
That’s not a large number. It’s not meant to be — it’s a $32,000 portfolio. What it is, is a number that only goes up if you keep feeding it, and a spreadsheet that shows it climbing is a considerably better behavioural tool than one that shows a portfolio value bouncing around by more than a year’s dividends every fortnight.
Featured on ReadySheetGo
Stock & Crypto Portfolio Tracker — includes a dedicated Dividend Tracker tab that takes shares held, cost basis per share, ex-dividend date, payment date and the amount received, and returns dividend per share, annual projected income and yield on cost for every position automatically — alongside a 50-row Stock Trade Log with cost basis and short-term/long-term holding classification, Crypto Positions for up to 30 holdings across any exchange, a Watchlist with buy-zone alerts, Asset Allocation with rebalancing amounts across six asset classes, a 36-month performance log, a Tax Summary for Schedule D prep, and a Portfolio Dashboard. 9 tabs, 957 formulas, works in Excel and Google Sheets. Instant digital download — $17.99.
Illustrative figures only — not investment or tax advice. Dividend rates change and can be cut; confirm tax treatment with a qualified preparer.
Frequently Asked Questions
What is yield on cost and how do I calculate it?
Yield on cost is annual dividend income divided by what you originally paid for the shares, rather than by what they're worth today. For 120 shares bought at $27.40 that now pay $1.012 per share a year, it's $1.012 / $27.40 = 3.69%, against a current yield of 3.39% at a $29.85 share price. The gap between the two is the whole point: current yield tells you what a new buyer gets, yield on cost tells you what your past self bought you.
Why does my dividend tracker understate annual income for monthly payers?
Because most templates annualise a logged payment by multiplying it by four, which assumes quarterly. Log a single month from a monthly payer and you get a third of the real figure — $24.17 from Realty Income becomes $96.68 a year instead of $290. The fix is to log a full quarter as one row (three monthly payments summed) so the x4 is correct, or to add a payments-per-year column and multiply by that instead.
Do I need to track dividends separately if my broker already reports them?
Your broker reports what it paid you, in that account, for that tax year. A spreadsheet gives you three things it won't: income across every account at once, yield on cost per position measured against your actual entry price, and a forward projection of next year's income. The broker's 1099-DIV is a backward-looking tax document, not a planning tool.
Are dividends taxed differently from capital gains?
Qualified dividends are taxed at the same 0%, 15% or 20% rates as long-term capital gains, while ordinary (non-qualified) dividends are taxed as ordinary income — and qualification depends partly on a holding-period test around the ex-dividend date. REIT distributions are generally ordinary income rather than qualified, though a portion may be eligible for the qualified business income deduction. Your 1099-DIV splits the two for you; if you're planning around it, confirm your own treatment with a preparer.