How to Track Your Stock Portfolio in a Spreadsheet (Full Setup)
Your brokerage app already shows you a portfolio value, a gain number and a pie chart. So the honest question isn’t whether you can track your portfolio — it’s what a spreadsheet tells you that the app won’t.
Three things, mostly. It tells you what you own across accounts your broker can’t see — a second brokerage, an old employer plan, coins in cold storage. It tells you what a position actually cost you, including fees, in a record your broker won’t rewrite when you transfer or when a custodian changes hands. And it tells you what you’ll owe if you sell today, split short-term from long-term, before you press the button rather than after.
Here’s the full build, tab by tab, using one worked portfolio the whole way through so you can see every number connect. Every figure below is illustrative — a made-up but internally consistent portfolio — and you’d replace it with yours.
The Worked Portfolio
Six stock and ETF positions, four crypto positions, and some cash. Snapshot taken 21 August 2026.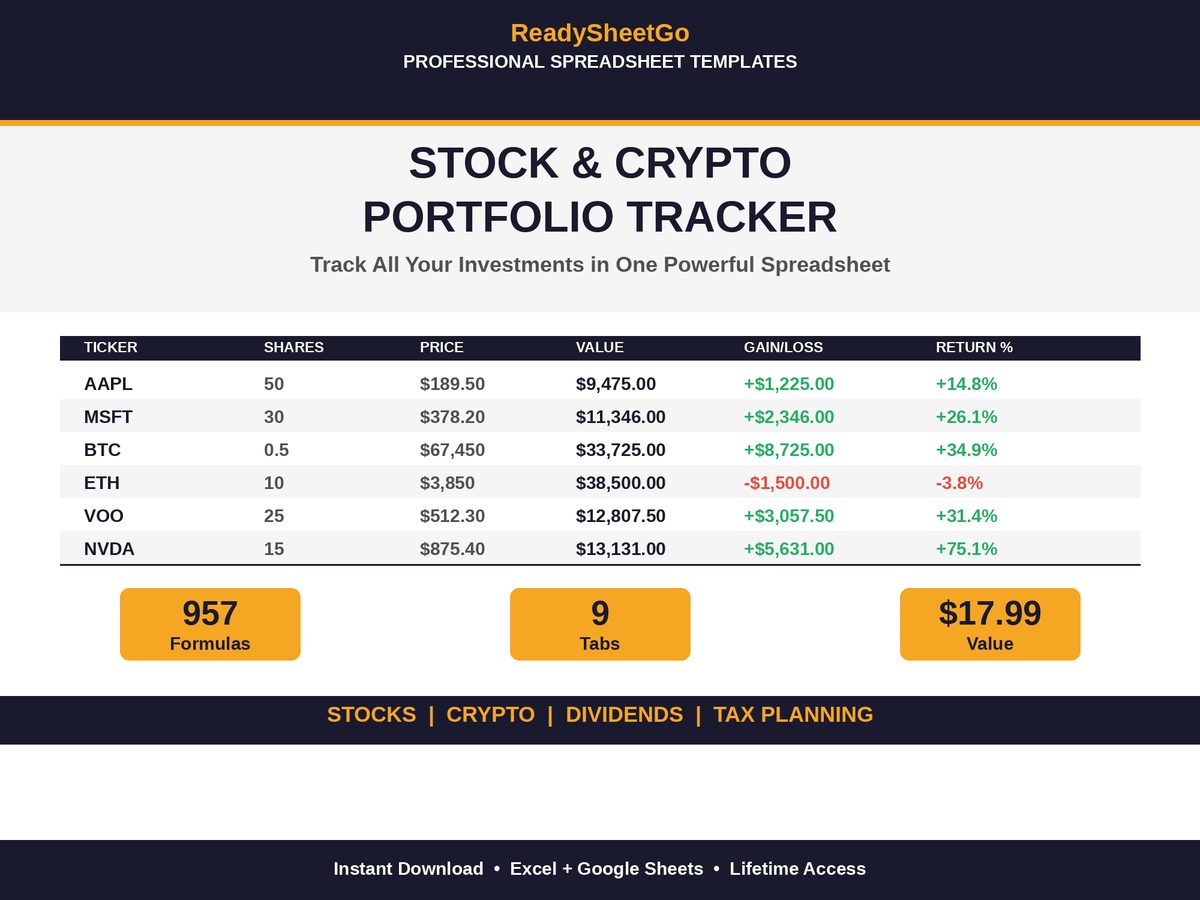
| Ticker | Bought | Shares | Price paid | Cost basis | Price now | Value now | Gain |
|---|---|---|---|---|---|---|---|
| VTI | 11 Mar 2024 | 40 | $248.00 | $9,920.00 | $291.00 | $11,640.00 | +$1,720.00 |
| SCHD | 5 Sep 2024 | 120 | $27.40 | $3,288.00 | $29.85 | $3,582.00 | +$294.00 |
| MSFT | 22 Jan 2025 | 12 | $412.50 | $4,950.00 | $455.00 | $5,460.00 | +$510.00 |
| O | 18 Jun 2025 | 90 | $56.20 | $5,058.00 | $58.10 | $5,229.00 | +$171.00 |
| VXUS | 4 Nov 2025 | 60 | $63.80 | $3,828.00 | $68.40 | $4,104.00 | +$276.00 |
| NVDA | 9 Feb 2026 | 15 | $128.00 | $1,920.00 | $141.60 | $2,124.00 | +$204.00 |
| Total | $28,964.00 | $32,139.00 | +$3,175.00 |
That’s a 10.96% total return on the stock side. Crypto adds another $12,596.00 of cost basis and $14,564.50 of current value, and there’s $4,300.00 sitting in a money market fund. Total portfolio: $51,003.50.
Hold onto that number. Almost everything useful in this build is a percentage of it.
Tab 1: The Trade Log — One Row Per Purchase, Never Overwritten
This is the tab everything else depends on, and it’s the one people get wrong first.
The rule: one row per purchase lot, and the price in that row never changes. If you bought VTI three times, that’s three rows, not one row you keep editing. Each row records the date, the ticker, the share count, the price you actually paid, and the commission or fee.
Two things fall out of that automatically:
Cost basis = shares × price paid + fees. For the VTI row, 40 × $248.00 = $9,920.00. Fees get added to basis on a buy (and subtracted from proceeds on a sale), which is why the fee column belongs here and not in a general expenses list.
Holding period = today minus the purchase date, which a spreadsheet handles with =TODAY()-A4, and the short-term/long-term flag falls straight out of it: =IF(L4>=365,"Long-Term","Short-Term"). In the worked portfolio, four positions are already long-term (VTI at 893 days, SCHD at 715, MSFT at 576, O at 429) and two aren’t (VXUS at 290, NVDA at 193). That single column is worth more than most of the dashboard, because it’s the one that changes what you’d do today. What selling before that clock runs out actually costs is worth its own arithmetic.
One column worth adding. Most trade-log layouts, including the one in our template, calculate a row’s value from the same price cell that feeds cost basis. That’s fine as long as you treat the trade log as a permanent acquisition record and keep current prices somewhere else. If you’d rather see live gain per row, insert a Current Price column beside Price Paid and point the value formula at the new column — so Current Value = Shares × Current Price while Cost Basis = Shares × Price Paid + Fee stays frozen. Two minutes of setup, and it removes the only way this tab can lie to you.
Tab 2: Dividends — Because Return Isn’t Just Price
A price-only tracker quietly understates what you’ve earned. The worked portfolio holds three income positions, and on the assumed rates below they throw off real money:
| Position | Shares | Cost/share | Assumed annual dividend/share | Annual income | Yield on cost | Current yield |
|---|---|---|---|---|---|---|
| SCHD | 120 | $27.40 | $1.012 | $121.44 | 3.69% | 3.39% |
| O | 90 | $56.20 | $3.222 | $289.98 | 5.73% | 5.55% |
| MSFT | 12 | $412.50 | $3.32 | $39.84 | 0.80% | 0.73% |
| VTI | 40 | $248.00 | $3.60 | $144.00 | 1.45% | 1.24% |
| VXUS | 60 | $63.80 | $2.10 | $126.00 | 3.29% | 3.07% |
| Total | $721.26 | 2.49% | 2.24% |
$721.26 a year, against $28,964.00 of money actually invested — a 2.49% yield on cost. That’s a different and more useful number than the 2.24% current yield, because it measures the income against what you paid, not against what the market happens to charge today. It’s the number that rises over the years while the current yield stays roughly flat, and watching it climb is most of the reason dividend investors keep a spreadsheet at all. The full method, including the trap monthly payers set.
Tab 3: Crypto — One Row Per Venue, Not Per Coin
Crypto needs its own tab, and the reason is structural rather than sentimental: the same coin sitting in two places is two different tax lots.
| Coin | Where | Quantity | Avg cost | Total cost | Price now | Value | Gain |
|---|---|---|---|---|---|---|---|
| BTC | Coinbase | 0.08500 | $61,200 | $5,202.00 | $74,500 | $6,332.50 | +$1,130.50 |
| ETH | Kraken | 1.400 | $2,980 | $4,172.00 | $3,150 | $4,410.00 | +$238.00 |
| ETH | Cold wallet | 0.600 | $2,410 | $1,446.00 | $3,150 | $1,890.00 | +$444.00 |
| SOL | Coinbase | 12.00 | $148.00 | $1,776.00 | $161.00 | $1,932.00 | +$156.00 |
| Total | $12,596.00 | $14,564.50 | +$1,968.50 |
Two ETH rows, not one. Merge them into a single 2.0 ETH row at a blended $2,809.00 and you’ve thrown away the information that decides your tax bill: sell 0.6 ETH out of the cheap wallet lot and the gain is $444.00; sell the same 0.6 ETH out of the Kraken lot and it’s $102.00. Same coin, same day, same price — a $342.00 difference in what you report, purely a bookkeeping choice you can only make if you kept the lots apart. Tracking crypto across exchanges and wallets properly is a short set of rules, and moving coins between your own wallets is where most people break their own records.
Tab 4: Asset Allocation — The Tab That Earns Its Keep
Here’s the payoff for putting everything in one file. Take the six asset classes, drop in the current values, and set the targets you actually intended:
| Asset class | Value | Current % | Target % | Drift | Action | To rebalance |
|---|---|---|---|---|---|---|
| US stocks (individual) | $12,813.00 | 25.1% | 25% | +0.1 | Hold | −$61 |
| ETFs / index funds | $15,222.00 | 29.9% | 30% | −0.1 | Hold | +$77 |
| International stocks | $4,104.00 | 8.0% | 15% | −7.0 | Buy | +$3,545 |
| Crypto | $14,564.50 | 28.6% | 10% | +18.6 | Reduce | −$9,466 |
| Bonds / fixed income | $0.00 | 0.0% | 10% | −10.0 | Buy | +$5,100 |
| Cash / money market | $4,300.00 | 8.4% | 10% | −1.6 | Hold | +$801 |
| Total | $51,003.50 | 100% | 100% |
The formula behind the Action column is one line — =IF(drift>2%,"SELL/REDUCE",IF(drift<-2%,"BUY/ADD","HOLD")) — and the dollar column is just (target% − current%) × total. A 2-percentage-point band stops the sheet nagging you about rounding noise; the three flags that survive it are real.
And they’re the sort of thing that’s genuinely invisible without this tab. This investor believes they hold 10% crypto. They hold 28.6% — nearly $9,500 more than intended, entirely because it went up and nobody re-checked. They also hold no bonds at all against a 10% target, which is the kind of gap that only ever gets noticed on purpose.
What you do about it is your call and depends on taxes, conviction and account type — selling $9,466 of appreciated crypto in a taxable account is a decision with a tax bill attached, and directing new contributions toward the underweight classes instead is the cheaper way to close a gap that isn’t urgent. The spreadsheet’s job is to put the number in front of you, not to make the trade.
Tab 5: The Monthly Snapshot
One row per month: stock value, crypto value, other assets, total, and the change on the previous month. Twelve numbers a year, each one taking about thirty seconds to record.
The reason it matters is that every other tab shows you now. This one shows you the shape of the thing — that a 10.96% gain arrived in two lumps and a long flat stretch, or that the month you felt panicky was a 4% drawdown rather than the disaster it felt like. It also catches contributions honestly: log deposits and withdrawals in their own column, or you’ll congratulate yourself for growth you actually just paid in.
Tab 6: The Realized Gains Log
Nothing goes in here until you sell. When you do, one row: what you sold, date bought, date sold, proceeds, cost basis, fees, and the resulting gain or loss with its short/long-term flag.
Two reasons to keep it separately from the trade log. First, it’s the tab you hand your preparer, and it should contain only closed positions. Second, it’s the running total that tells you mid-year whether you’re sitting on net gains — useful information in November, when there’s still time to do something about it, and useless in April.
The Ten-Minute Monthly Routine
The build is a one-off. This is the part that has to survive:
- Paste current prices into the price column for each position — six stock rows and four crypto rows here, under two minutes.
- Log any dividends received since last time, one row each.
- Record the month’s total on the snapshot tab, plus any deposits.
- Glance at the allocation drift column. If nothing’s outside the band, you’re done.
- Log any sales in the realized gains tab, while you still remember the details.
Ten minutes, once a month. Do it on the same day each month — the first weekend, the day after payday, whatever sticks — and the tracker becomes a record instead of a project.
Should You Build This or Buy It?
Everything above is buildable in a free afternoon, and if you enjoy spreadsheets you’ll build a better-fitting one than anything you can buy, because you’ll know exactly which columns you actually use.
The case against is just the formula count. A working version of the six tabs above runs to several hundred formulas once you include the per-row cost basis, holding-period flags, yield-on-cost math, drift calculations and dashboard rollups — and formula bugs in a portfolio tracker are quiet. A wrong sign or an off-by-one range doesn’t error, it just reports a return that’s a bit wrong forever. The full trade-off against a subscription portfolio app is worth reading before you commit either way.
Featured on ReadySheetGo
Stock & Crypto Portfolio Tracker — the six tabs above, pre-built with 957 working formulas across 9 tabs. A Stock Trade Log (50 rows) with automatic cost basis, holding period and short-term/long-term classification; a Dividend Tracker calculating dividend per share, annual projected income and yield on cost per position; Crypto Positions for up to 30 holdings across any exchange or wallet with per-position gain/loss and share of the crypto book; a Watchlist with target buy prices and automatic green/amber/red buy-zone alerts; an Asset Allocation tab with target-versus-actual across six asset classes, rebalancing actions and dollar amounts; a 36-month Performance log with monthly and cumulative return; a Tax Summary splitting realized gains short-term from long-term for Schedule D prep; and a Portfolio Dashboard tying it together. Works in Excel and Google Sheets, no macros. Instant digital download — $17.99.
Nothing here is investment or tax advice. The portfolio, prices and dividend rates above are illustrative figures chosen to make the arithmetic clear, not recommendations, and tax outcomes depend on your own situation — check specifics with a qualified preparer.
Frequently Asked Questions
What should a stock portfolio spreadsheet actually track?
Six things, and they belong on separate tabs: one row per purchase lot with the price you paid and the date (that's your cost basis and your holding-period clock), dividends received per position, crypto positions listed per exchange or wallet, a target-versus-actual asset allocation, a monthly total-value snapshot, and a realized gains log for tax time. Anything beyond that is decoration. Anything less and you'll be reconstructing numbers from statements in April.
How often do I need to update a portfolio tracker spreadsheet?
Prices monthly, transactions on the day they happen. Updating prices daily is the fastest way to abandon a tracker — the number moves more than your decisions do. A ten-minute monthly pass (paste current prices, log any dividends, record the month's total) is enough to keep allocation drift and yield on cost accurate, and it gives you a twelve-point trend line instead of noise.
Can a spreadsheet pull live stock prices automatically?
In Google Sheets, yes: =GOOGLEFINANCE("MSFT","price") returns a delayed quote, and =GOOGLEFINANCE("CURRENCY:BTCUSD") handles major crypto pairs. In Microsoft 365 versions of Excel, the Stocks data type does the same job — convert a cell containing a ticker to a Stocks entity and reference .Price. Neither works in every version or region, which is why a well-built template leaves the price cell as a plain number you can type or link, rather than hard-wiring a function that breaks for half the people who open the file.
Should I keep stocks and crypto in the same spreadsheet?
Yes for allocation and net worth, separately for position detail. You can't see that crypto has grown to 28% of your portfolio if the crypto lives in a different file — that's the single most useful thing a combined tracker tells you. But crypto needs its own tab because it needs columns stocks don't: which exchange or wallet holds it, quantity to eight decimal places, and a per-venue cost basis that transfers between wallets must not disturb.