A Spreadsheet to Track Multiple Vending Machines and Profit Per Location
With one machine, you know how it’s doing. With three, you have a rough feel. With six, you’re guessing — and the guess is usually anchored to whichever machine gave you the fattest bag of cash most recently, which is not the same thing as the machine making you the most money — and is a weaker signal every year, now that cash is a shrinking slice of vending payments.
The fix isn’t software with a monthly fee. It’s one file structured so the answers fall out of the data you’re already collecting on every service visit.
The Structure: Four Sheets That Feed Each Other
The whole thing works because you enter each fact exactly once.
1. Machines (the register). One row per unit: machine ID, location name, type, install date, purchase cost, payout type (flat rent or % of sales), the rate, status, notes. This is the sheet everything else looks up against.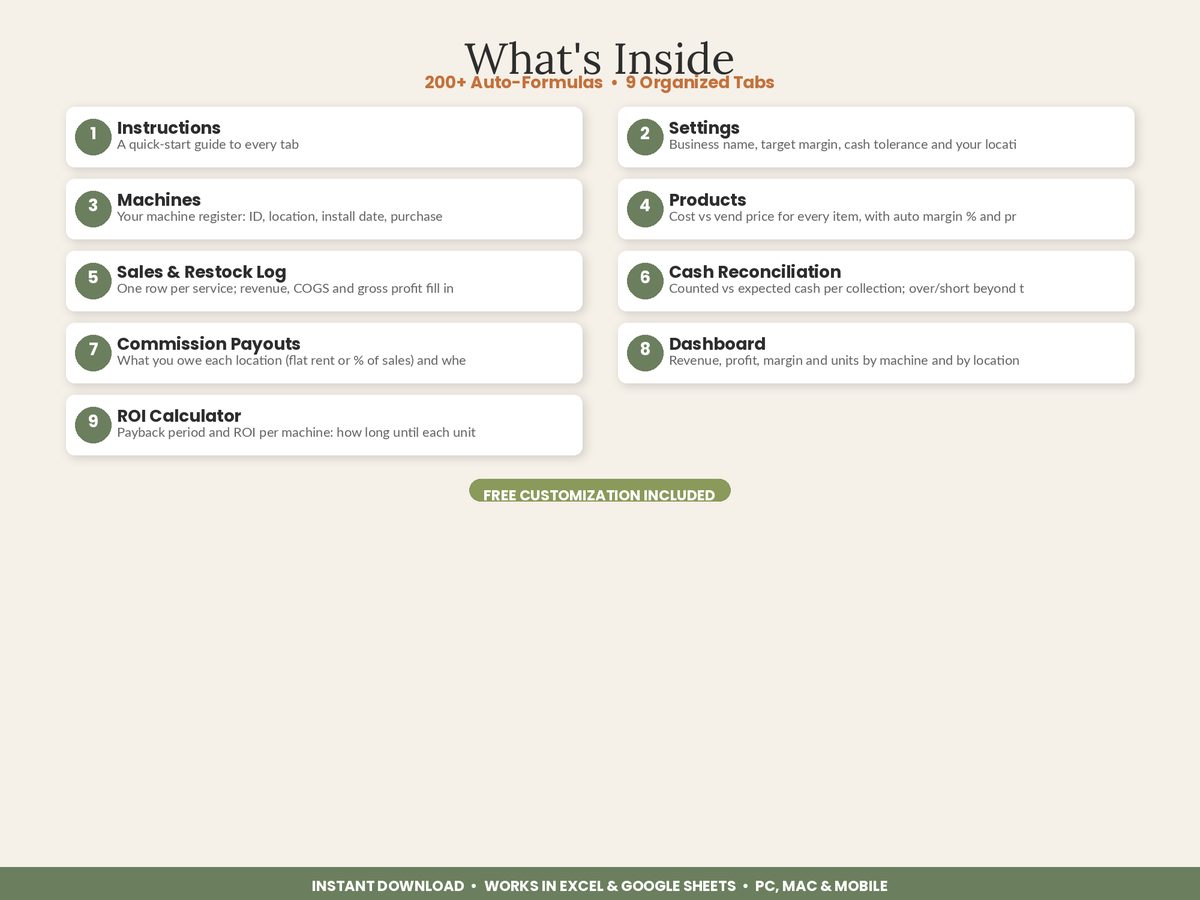
2. Products. One row per item: name, category, unit cost, vend price. Profit per unit and margin % calculate themselves. Add a health flag — green if margin clears your target, red if it doesn’t — and weak products announce themselves.
3. Sales & Restock Log. One row every time you service a machine: date, machine ID, product, units sold. Unit cost and vend price pull in from the Products sheet automatically; revenue, cost of goods, and gross profit calculate from there. This is the only sheet you touch regularly.
4. Dashboard. Nothing entered here. Formulas roll the log up by machine and by location.
The critical design decision is that machine ID and product name are keys, not labels. Type “VM-003” in the log and every downstream number knows which location it belongs to, what rent that location charges, and how to bill it. Type “laundromat machine” one week and “Maple St” the next, and none of it aggregates.
Why Gross Sales Ranks Machines Wrong
Here’s a route where the busiest machine is not the best machine.
| Machine | Location | Revenue | COGS | Payout | Net profit | Margin |
|---|---|---|---|---|---|---|
| VM-001 | Downtown gym | $612 | $245 | $75 flat | $292 | 47.7% |
| VM-002 | Office park | $840 | $378 | 15% = $126 | $336 | 40.0% |
| VM-003 | Laundromat | $310 | $118 | $60 flat | $132 | 42.6% |
| VM-004 | College hall | $528 | $232 | 20% = $106 | $190 | 36.0% |
By revenue, VM-002 is your star at $840. By margin, it’s third. VM-001 does 27% less business and keeps almost as much of it, because a flat $75 on a strong machine beats a percentage that scales up with every good month.
That’s an actionable insight, and it’s invisible until net profit and margin sit in the same table. The lesson generalizes: flat rent rewards you for growing a location; commission rewards the location for your growth. Knowing which of your sites is on which — and what that costs you at current volume — is a five-minute exercise once the data is structured and an impossible one when it isn’t.
The Vending Machine Business Tracker from ReadySheetGo is built on exactly this layout: a machine register feeding a sales log, a dashboard that ranks revenue, profit, margin and units by machine and by location, and a commission tab that calculates flat rent or percentage payouts per period and tracks whether each one is paid.
Product Margin Is the Other Half
Machine-level numbers tell you where to put your next unit. Product-level numbers tell you how to make the units you have earn more, and it’s the cheaper of the two levers.
| Product | Unit cost | Vend price | Profit/unit | Margin |
|---|---|---|---|---|
| Bottled water | $0.35 | $1.50 | $1.15 | 76.7% |
| Cola 20oz | $0.65 | $2.00 | $1.35 | 67.5% |
| Potato chips | $0.45 | $1.25 | $0.80 | 64.0% |
| Energy drink | $1.10 | $2.75 | $1.65 | 60.0% |
The energy drink returns the most dollars per vend and the least margin. Neither number is the “right” one to optimize — the answer depends on whether the machine’s constraint is slots or traffic — but you can’t make that call without both in front of you.
This is also where cost inflation shows up first. USDA’s Food Price Outlook has sugar and sweets running 7.1% higher in May 2026 than a year earlier, with a 6.9% increase forecast for 2026, and nonalcoholic beverages up 5.8% year over year. If your vend prices haven’t moved, that increase came directly out of the margin column — and a products sheet that recalculates when you update a unit cost will show you precisely which selections crossed below your target.
The Payout Tab Nobody Builds Until They Need It
Once you’re past a few locations, “did I pay the gym this month?” becomes a real question, and the answer lives in your text messages.
A commission sheet with period, machine ID, payout type, rate, machine sales for the period, payout due, and a paid yes/no gives you a monthly to-do list that builds itself. Machine sales pull from the log with a SUMIF. Payout due branches on whether the location is flat rent or percentage. What’s left is checking off payments.
The side benefit at tax time is real: those payouts are deductible business expenses, and having them itemized by location and period is considerably better than reconstructing them from your bank feed in April.
Sizing the Opportunity
Worth knowing what business you’re actually in. The convenience services industry — vending, micro markets, and now smart coolers — hit an estimated $40.04 billion in 2025, up 18.3%, per the 2026 State of the Vending and Micro Market Industry report. More than 65% of operators reported revenue growth and over 70% increased their location count. Smart coolers reached 33.5% of deployed equipment, nearly matching traditional glass-front machines.
Which means the operators around you are adding formats and locations. Doing that well requires knowing which of your current locations actually earn — the operators who expand off gross collections tend to replicate their worst site.
Start With What You Already Do
You already visit the machines. You already count what came out. You already know what you restocked. The only new habit is entering four fields per selection into a log instead of a note on your phone.
A month in, you have a ranked route. A quarter in, you have seasonality. A year in, you know exactly which locations to renegotiate, which to leave alone, and which one to walk away from — which is the entire game in a business where the machines are cheap and the locations are everything.
Featured on ReadySheetGo
Vending Machine Business Tracker — 9 tabs for new and scaling vending operators. Machine register with purchase cost and commission terms, product sheet with auto margin % and profit-per-unit health flags, sales & restock log where revenue and COGS fill in automatically, cash reconciliation with over/short alerts, commission payout tracker for flat rent or % of sales, a dashboard ranking every machine and location by profit and margin, and an ROI Calculator with payback months per unit. Pre-filled with sample data. Works in Excel and Google Sheets, no macros. Instant digital download — $13.99.
Sources: USDA ERS — Food Price Outlook · Automatic Merchandiser — 2026 State of the Vending & Micro Market Industry
Frequently Asked Questions
How do you track multiple vending machines in one spreadsheet?
Give every machine a permanent ID (VM-001, VM-002) on a machine register, put every product on a products sheet with its cost and vend price, and log one row per service visit tagged with the machine ID and product. Revenue, cost of goods and gross profit then calculate per row, and SUMIF formulas roll totals up by machine and by location without you re-entering anything.
How do I know which vending location is most profitable?
Compare net profit per machine after the location's rent or commission is deducted, not gross sales. A high-traffic site on a 20% commission can return less than a quieter site on $60 flat rent. Ranking machines by net profit and by margin percentage side by side shows both which locations earn most and which earn most efficiently for the capital tied up in them.
Should I track vending sales per product or just total collections?
Per product, at least at the category level. Total collections tell you a machine made money but not which selections did it. Product-level logging is what lets you see that bottled water at $0.35 cost and $1.50 vend is carrying a 77% margin while a $1.10 energy drink at $2.75 carries 60%, and adjust the planogram accordingly.
How much does a vending machine make per month?
A typical U.S. machine in a decent location grosses roughly $300 to $1,500 a month, with $250 to $1,000 commonly cited for a modern machine accepting cashless payment. Net profit is a fraction of that after cost of goods, which usually runs 35% to 50% of revenue, and after the location's rent or commission. The spread between machines on the same route is often larger than the spread between operators.