Student Loan Payoff Spreadsheet: Track Every Loan and Your Real Payoff Date
You have six loans. Three of them are from undergrad, two from grad school, one is private. Two different servicers, two different logins, two different websites that each show you a balance and almost nothing else.
Here is the question neither portal will answer: what date are you actually done?
Full walkthrough of the template used in this guide.
Not the date on the standard schedule you were dropped into by default. The date you finish given what you are actually paying, in the order you are actually paying it. And underneath that, the question behind the question — is the way you are paying right now the cheapest route out, or is it costing you years you did not need to spend?
This guide costs a full six-loan portfolio end to end. Every assumption is labelled, so you can swap in your own numbers and the method still holds.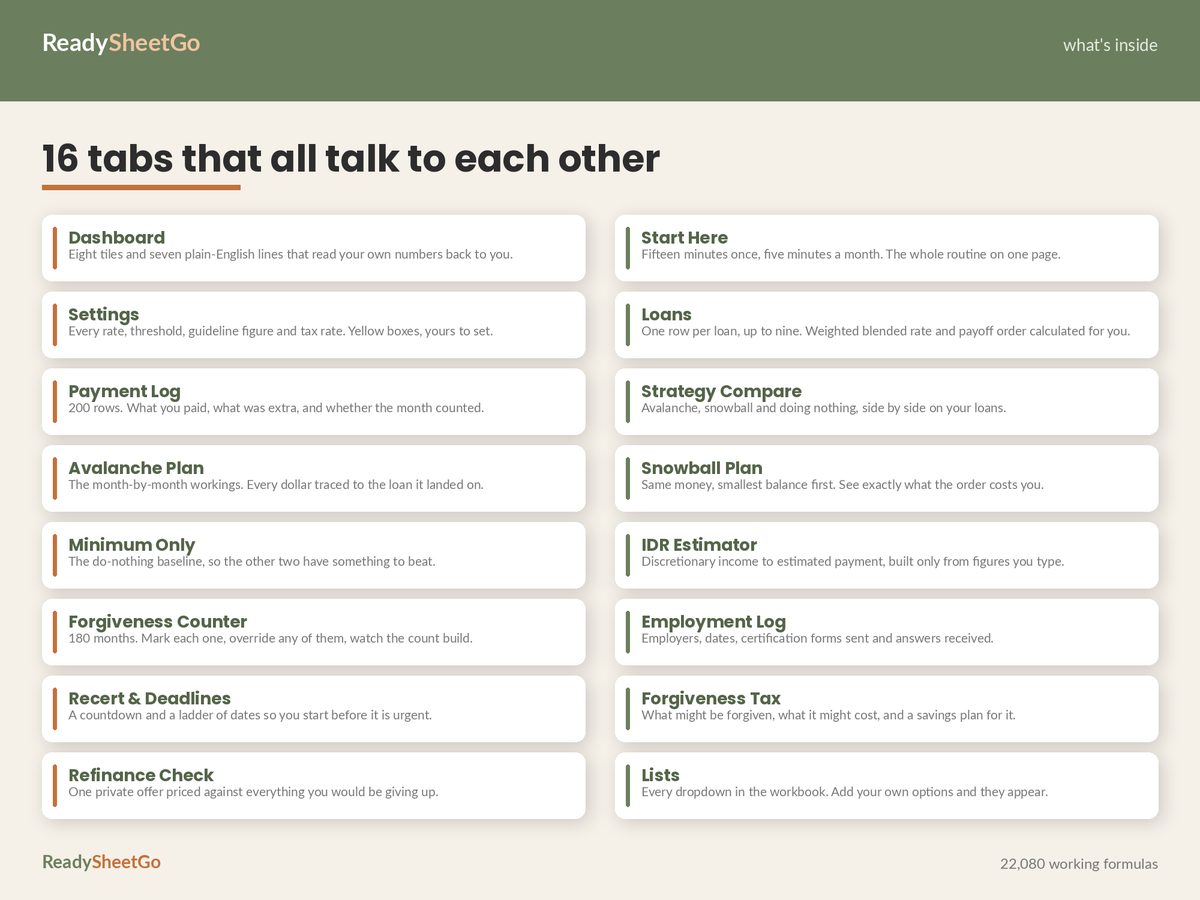
The Six Columns That Describe a Loan
Everything else is derived. You need, per loan:
- Nickname — “Loan D — Grad 1”, not the 19-digit account number.
- Servicer — because your loans do not all live in one place, and the one you forget is the one that goes delinquent.
- Current balance — today’s payoff figure, not the amount you borrowed.
- Interest rate — the single most important number, and the one nobody remembers.
- Minimum payment — what the servicer demands each month.
- Loan type — federal or private, and which flavour of federal. This column decides which of your options are even available.
Six columns, one row per loan. That is the whole input. Here is the portfolio this guide uses throughout:
| Loan | Servicer | Type | Balance | Rate | Minimum |
|---|---|---|---|---|---|
| Loan A — Undergrad 1 | Nelnet | Federal, subsidised | $4,180.44 | 4.53% | $58 |
| Loan B — Undergrad 2 | Nelnet | Federal, unsubsidised | $5,624.19 | 4.53% | $68 |
| Loan C — Undergrad 3 | Nelnet | Federal, unsubsidised | $6,912.05 | 4.99% | $80 |
| Loan D — Grad 1 | MOHELA | Federal, grad | $17,640.88 | 6.08% | $206 |
| Loan E — Grad 2 | MOHELA | Federal, grad | $18,011.32 | 7.54% | $219 |
| Loan F — Private | Sallie Mae | Private | $9,884.61 | 9.25% | $156 |
| Total | $62,253.49 | $787 |
Original borrowing was $68,500, so $6,246.51 of principal has been repaid. That is the first uncomfortable number: years of payments, and the balance has moved by less than a tenth.
The Four Numbers You Derive From Those Six Columns
1. Your weighted blended rate
Multiply each balance by its rate, add the products, divide by the total balance:
(4,180.44 × 4.53%) + (5,624.19 × 4.53%) + (6,912.05 × 4.99%) + (17,640.88 × 6.08%) + (18,011.32 × 7.54%) + (9,884.61 × 9.25%) = $4,134.01 $4,134.01 ÷ $62,253.49 = 6.6406%
This is the number every refinance offer is secretly competing against. A quote of 6.9% is worse than doing nothing here, even though it undercuts three of the six loans. Without the blended rate you cannot tell. The break-even rate is actually lower still — 6.249% on this portfolio — and here is why.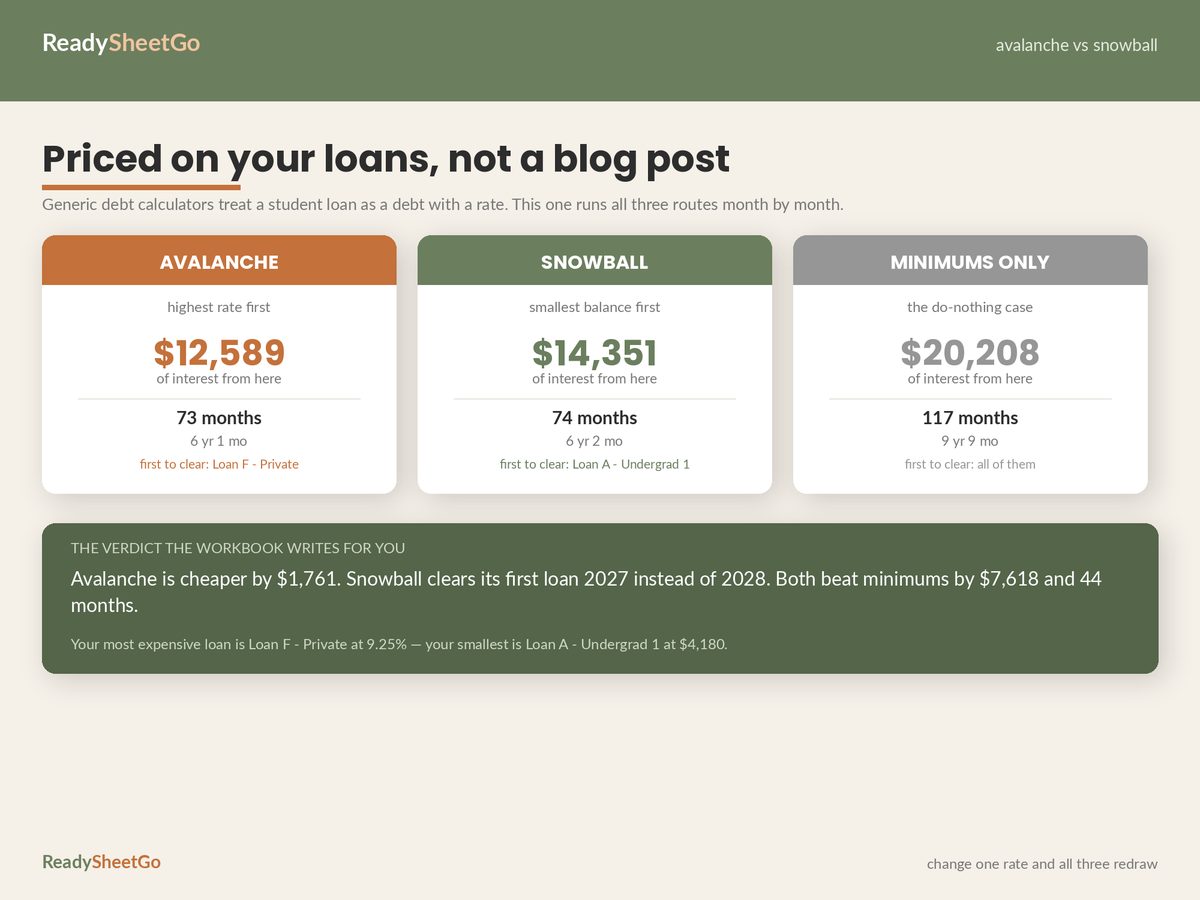
2. Interest per month, and per day
$4,134.01 ÷ 12 = $344.50 a month $4,134.01 ÷ 365 = $11.33 a day
Against a total minimum of $787, that means $442.50 of a $787 payment reaches principal and $344.50 evaporates. It also means that paying five days late costs $56.65 in extra accrual, which is the kind of thing that stops being abstract once you have seen it in a cell.
3. Each loan’s share of the damage
Loan F is 15.9% of the balance ($9,884.61 of $62,253.49) but 22.1% of the monthly interest ($914.33 of the $4,134.01 annual charge). Loans D and E together are 57.3% of the balance. Ranking loans by balance and ranking them by interest generated produce different orders — which is the entire argument between the two payoff methods.
4. Your payoff order, both ways
Sort by rate descending and you have your avalanche order: F, E, D, C, A, B. Sort by balance ascending and you have your snowball order: A, B, C, F, D, E. Note that Loan F sits first in one list and fourth in the other. That single disagreement is worth $1,761.11 here.
Three Routes Out, Priced
Assumptions in force: payments start September 2026, an extra $250 a month goes to the target loan on top of all minimums, and — this is the part people leave out — when a loan clears, its minimum rolls into the next target rather than back into your spending. That rolling is what makes either method work.
| Route | Months | Debt-free | Total interest | First loan cleared |
|---|---|---|---|---|
| Avalanche (highest rate first) | 73 | Sep 2032 | $12,589.42 | Dec 2028 (Loan F) |
| Snowball (smallest balance first) | 74 | Oct 2032 | $14,350.53 | Oct 2027 (Loan A) |
| Minimums only ($787, nothing rolled) | 117 | May 2036 | $20,207.65 | — |
Three things fall out of that table, and only the third one usually surprises people.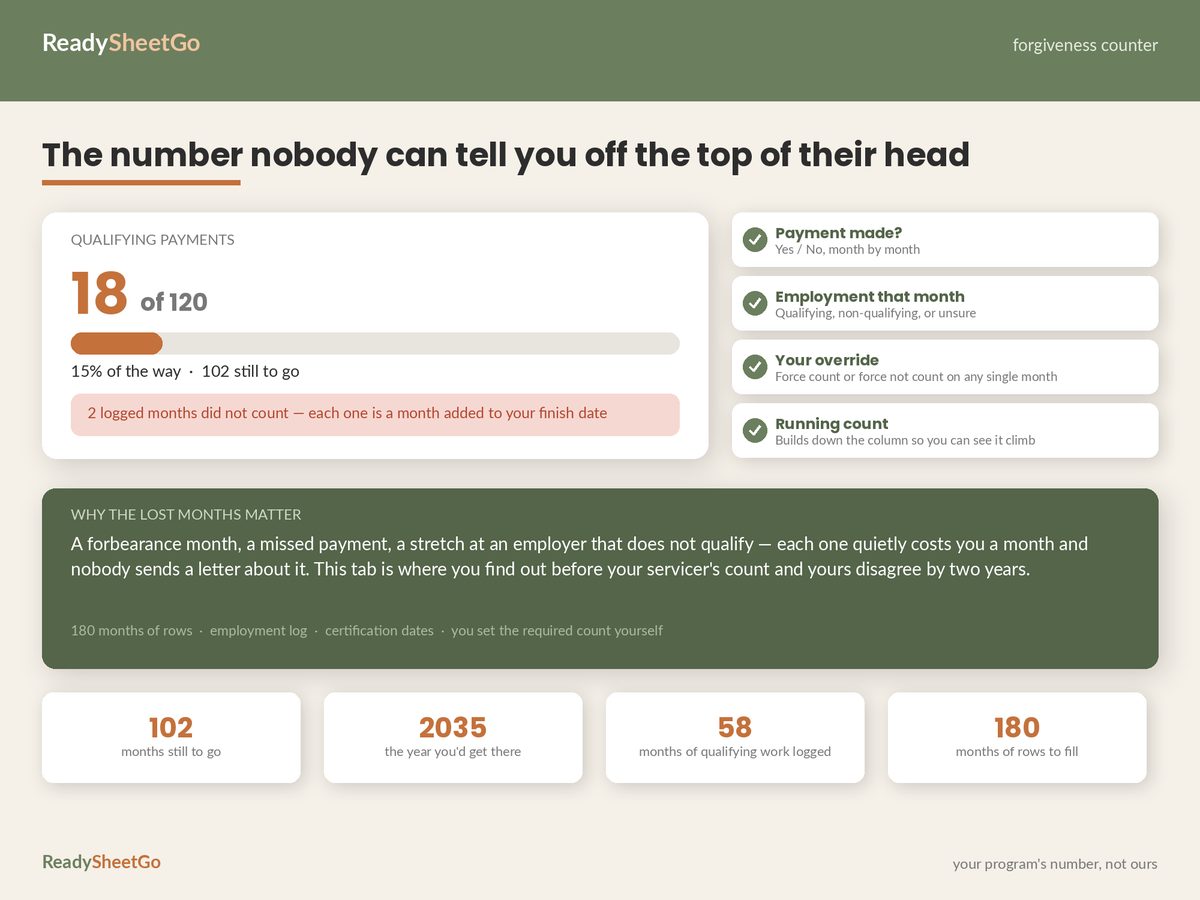
Avalanche is cheaper. By $1,761.11 and one month. Real money, but not life-changing money.
Snowball is faster to feel like something. Its first loan disappears in month 14; the avalanche’s takes until month 28. Fourteen months is a long time to see no account close, and plenty of people abandon a plan in that window. A plan you abandon costs more than $1,761.
The real decision is not avalanche versus snowball at all. It is either of them versus the default. Doing nothing but the minimums costs $7,618.23 more and 44 extra months than the avalanche. The choice between the two methods is worth about 23% of what the choice to have a method at all is worth ($1,761.11 against $7,618.23). The full side-by-side, including what happens when the two orders disagree.
And the $250 is not a magic number. At $100 a month the same portfolio finishes 28 months early and saves $4,218.73 — the returns are steep at the bottom of the scale, which is the opposite of what most people assume.
The Four Things a Generic Debt Tracker Gets Wrong
Every debt payoff template treats a loan as a balance and a rate. For a credit card, that is the whole truth. For a student loan, it is about half.
A payment tied to your income, not your balance
On an income-driven plan the monthly figure is calculated from your income and household size, not from what you owe. The arithmetic runs: counted income, minus a protected-income figure, gives discretionary income; a percentage of that, divided by twelve, is your payment.
Using the figures in the worked file — counted income $61,400, protected income $31,725, 10% of discretionary — that is:
$61,400 − $31,725 = $29,675 discretionary $29,675 × 10% ÷ 12 = $247.29 a month
Against a standard payment of $787. That looks like relief, and month to month it is. But the interest charge on this portfolio is $344.50, so:
$344.50 − $247.29 = $97.21 of unpaid interest every month
The balance grows by $97.21 a month while you make every payment on time. That is negative amortisation, and it is the single most important number an income-driven borrower can know — because whether it is acceptable depends entirely on whether you are heading for forgiveness or heading for a payoff. If forgiveness, a growing balance is irrelevant. If payoff, it is a trap.
Every threshold above is an input, not a fact. Protected-income figures, the percentage of discretionary income, and which plans exist at all are set by rules that change. Take yours from your servicer or studentaid.gov and type them in; do not inherit them from a blog post, including this one.
A qualifying-payment count nobody can tell you
If you are working toward forgiveness through public service, your progress is a count of qualifying months. The worked file shows 18 counted out of 120 required, with 2 payments made that did not count — 15% of the way, 102 to go, on track for early 2035.
Two payments that did not count is the normal case, not an error. Payments made during the wrong employment, in the wrong plan, in a forbearance, or in a month the paperwork lapsed all fail to count, and you generally find out long afterward. Your own month-by-month record, with the employer and the plan noted against each payment, is the only thing you will have to argue with. How to keep a qualifying-payment count that survives a servicer transfer.
A recertification deadline that changes your payment
Income-driven payments are recalculated annually and require you to recertify. Miss it and your payment can jump to the standard figure — in this portfolio, from $247.29 to $787, a $539.71 swing arriving in a month you had not planned for it. The file shows 75 days to the next recertification, with warnings laddered at 90, 60, 30 and 7 days. It is a calendar problem masquerading as a finance problem, and it is the cheapest one on this list to solve.
A tax bill at the far end
Forgiveness is not automatically free. Depending on the route and the law in the year it happens, a forgiven balance can be treated as taxable income. In the worked file, a balance projected at $75,529.40 at the forgiveness date, taxed at a blended 26.75%, produces an estimated $20,204.11 bill:
$20,204.11 ÷ 60 months = $336.74 a month set aside, starting five years out
Whether that applies to you depends on the programme and on tax law at the time, which is exactly why it belongs in a cell you control rather than baked into a template. What is not optional is knowing the number, because a borrower who reaches forgiveness and meets a five-figure tax bill they never modelled has not actually finished.
What to Do This Week
You do not need a year of history to start.
- Pull the six columns for every loan. Log into each servicer once and write down balance, rate, minimum and type. Under an hour, and it is the only genuinely tedious part.
- Calculate your blended rate and your monthly interest. Two formulas. This alone reframes the problem for most people.
- Rank the loans twice — by rate, and by balance. If the top of both lists is the same loan, your decision is made. If not, you have a real choice to make and now you can see it.
- Pick a number you will actually pay every month, and make it the same number forever. The mechanism that does the work is not the extra $250. It is holding total outflow constant so that every cleared minimum rolls forward instead of quietly becoming spending.
- If you are on an income-driven plan, work out your negative amortisation. Monthly interest minus your payment. If it is positive, decide deliberately whether that is acceptable — because on the forgiveness track it does not matter, and on the payoff track it is the whole problem.
- Put the recertification date in a calendar with a 60-day warning. Today. It takes ninety seconds and it is worth more than any of the optimisation above.
The value of doing this in a spreadsheet rather than a calculator is that a calculator answers one question once. Your rate changes, your income changes, a loan clears, a servicer transfers, and the answer moves. When all six loans, both payoff orders, the income-driven estimate, the qualifying count and the tax projection sit in one file that recalculates together, you stop re-deriving your situation every few months and start managing it.
Featured on ReadySheetGo
Student Loan Payoff, IDR & Forgiveness Progress Tracker — $14.99
Sixteen connected tabs and 22,080 working formulas, built exactly as above, with room for up to nine loans — federal and private together in one file.
Loans takes the six columns and returns your weighted blended rate, total minimum, interest per month and per day, each loan’s share of the debt and both payoff orders. Strategy Compare puts avalanche, snowball and minimum-only side by side as full month-by-month simulations — not rules of thumb — returning months to debt-free, total interest and payoff date under each, with Avalanche Plan, Snowball Plan and Minimum Only tabs holding the workings behind every column. A 200-row Payment Log records what you paid, how much was extra, and whether that month counted.
Then the four things generic trackers miss: an IDR Estimator walking from counted income to protected income to discretionary income to an estimated payment, then telling you whether that payment covers your interest and by how much your balance grows if it does not; a Forgiveness Counter with 180 month rows and a manual override on every one, plus an Employment Log for employers, dates and forms sent; a Recert & Deadlines countdown with warnings at 90, 60, 30 and 7 days; a Forgiveness Tax tab estimating what might be forgiven, what it might cost and a 60-month savings plan for it; and a Refinance Check pricing one private offer against everything you would be giving up.
Every programme rule — required payment count, protected-income figure, percentage of discretionary income, tax rate — is a yellow input box you fill in from your own servicer’s current figures. Nothing is baked in. Sample data pre-filled across six loans. Works in Excel and Google Sheets, no macros and no add-ons.
Get the Student Loan Payoff, IDR & Forgiveness Tracker →
Frequently Asked Questions
How do you track multiple student loans in a spreadsheet?
One row per loan, with six columns that do the work: nickname, servicer, current balance, interest rate, minimum payment and loan type. From those six, a spreadsheet derives everything else — your weighted blended rate, the interest accruing per month and per day, each loan's share of the debt, and your payoff order under both the avalanche and the snowball method. The worked portfolio in this guide runs six loans across two federal servicers and one private lender: $62,253.49 total, a 6.6406% blended rate, and $344.50 of interest charged every month before a dollar of principal moves.
What is a weighted blended rate on student loans and why does it matter?
It is the single interest rate that would produce the same monthly interest charge as your actual mix of loans. You calculate it by multiplying each balance by its rate, adding those products, and dividing by your total balance. In the worked example it comes to 6.6406% across six loans ranging from 4.53% to 9.25%. It matters because it is the number every refinance offer is implicitly competing against — a quote of 6.9% on this portfolio is worse than doing nothing, even though it is lower than three of the six loans.
Is avalanche or snowball better for student loans?
In the worked six-loan portfolio, avalanche clears the debt in 73 months for $12,589.42 of interest and snowball takes 74 months for $14,350.53 — avalanche wins by $1,761.11 and one month. But snowball clears its first loan in month 14 against the avalanche's month 28. The gap between the two methods is usually small; the gap between either of them and paying only minimums is enormous, at $7,618.23 and 44 months in this example.
Do I need a special spreadsheet for student loans instead of a normal debt tracker?
A generic debt payoff tracker models a balance and a rate, which is all a credit card is. A student loan also has a payment that can be tied to your income rather than your balance, a count of qualifying payments toward forgiveness that your servicer and your own records will eventually disagree about, a recertification deadline that changes your payment if you miss it, and a possible tax event on any forgiven balance. None of those four are things a snowball calculator can represent, and all four change what the right payoff strategy is.