How Much Is My Inventory Worth? Valuing Stock at Cost and at Retail
Ask a small business owner what their stock is worth and you usually get one of two answers: a shrug, or a number that turns out to be the total of what they paid on the last few invoices.
The honest answer is that there are two numbers, they are far apart, and each one answers a question the other cannot.
Full walkthrough of the template used in this guide.
Here are eight lines from a 24-SKU gift shop — a made-up shop, but the arithmetic is the arithmetic:
| SKU | Product | Cost | Retail | On hand | Value @ cost | Value @ retail |
|---|---|---|---|---|---|---|
| CAN-LAV-8 | Lavender candle 8oz | $6.40 | $22.00 | 12 | $76.80 | $264.00 |
| CAN-CED-8 | Cedar candle 8oz | $6.40 | $22.00 | 48 | $307.20 | $1,056.00 |
| SOP-OAT-BAR | Oat & honey soap | $2.15 | $9.00 | 0 | $0.00 | $0.00 |
| MUG-STO-12 | Stoneware mug 12oz | $7.80 | $26.00 | 34 | $265.20 | $884.00 |
| TWL-LIN-SET | Linen tea towel set | $9.25 | $32.00 | 6 | $55.50 | $192.00 |
| DIF-REED-100 | Reed diffuser 100ml | $11.50 | $38.00 | 19 | $218.50 | $722.00 |
| GFT-BOX-SM | Small gift box | $1.35 | $5.00 | 210 | $283.50 | $1,050.00 |
| ORN-BRASS-STAR | Brass star ornament | $4.90 | $18.00 | 61 | $298.90 | $1,098.00 |
| Total, these eight | $1,505.60 | $5,266.00 |
Same shelf. $1,505.60 or $5,266.00, depending on which question you are asking. The difference — $3,760.40, or 71.4% of the retail figure — is the gross profit currently locked up in stock.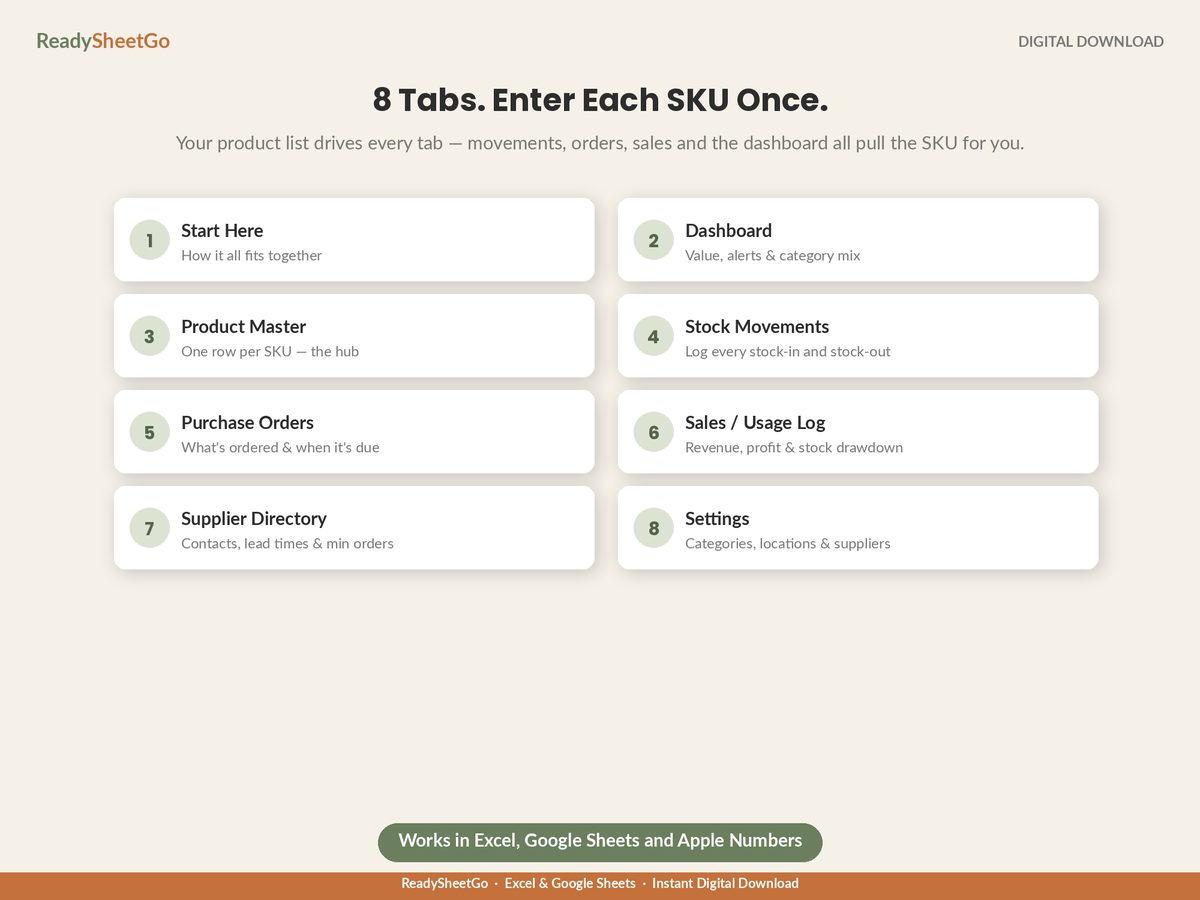
The Two Numbers and What Each One Is For
Value at cost = on hand × unit cost.
This is your money. It is what you have already spent that is currently sitting on a shelf instead of in the bank. It is the figure that goes on your balance sheet, the figure your accountant needs at year end, and the input to cost of goods sold.
It answers cash questions:
- Can I afford to place a $900 order this month?
- How much of my working capital is tied up in stock right now?
- Which category is holding the most of my cash?
Value at retail = on hand × retail price.
This is what the shelf is capable of turning into. It answers revenue questions:
- Is there enough stock in the building to support a $4,000 month?
- If I sold everything I own, what would it produce?
- Which categories are thin going into a busy season?
The gap between them — the potential gross profit — is worth tracking on its own, because it moves for two very different reasons. It falls when you sell things, which is good. It also falls when you discount, which is not, and a sheet showing only the cost value will never notice.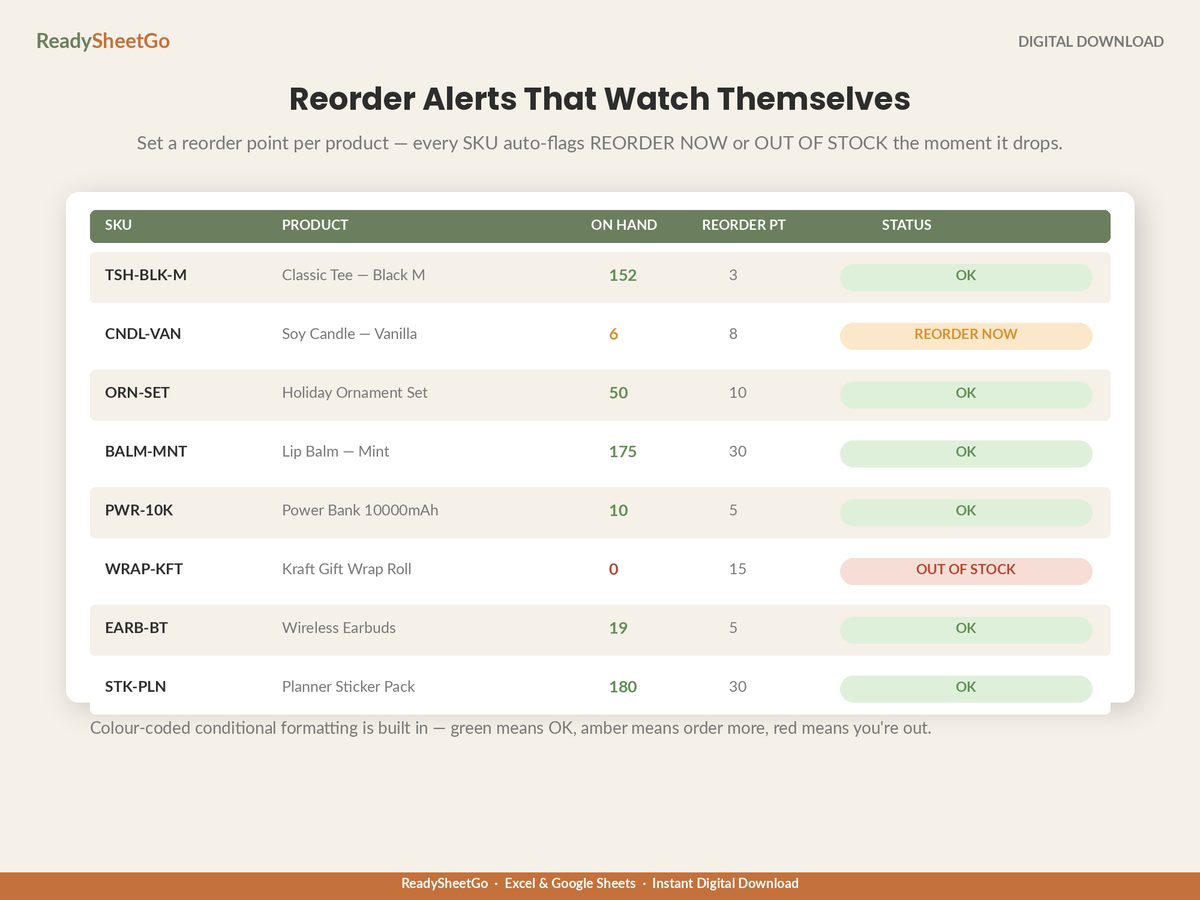
Getting Unit Cost Right: Landed, Not Invoiced
Every figure above depends on one input being honest, and it is the one most commonly wrong.
Unit cost should be landed cost: supplier price, plus inbound shipping, plus duty and handling, divided across the units actually received.
A case of 24 soaps at $46, with $5.60 shipping, is:
($46.00 + $5.60) ÷ 24 = $2.15 per bar, not $1.92.
Twenty-three cents. Invisible on one bar. Across 148 bars a quarter it is $34, and about $140 over a year — and, more importantly, using $1.92 overstates your gross margin on soap from 76.1% to 78.7%, on every single line, forever. Every pricing decision downstream inherits the error.
Two rules that keep it clean: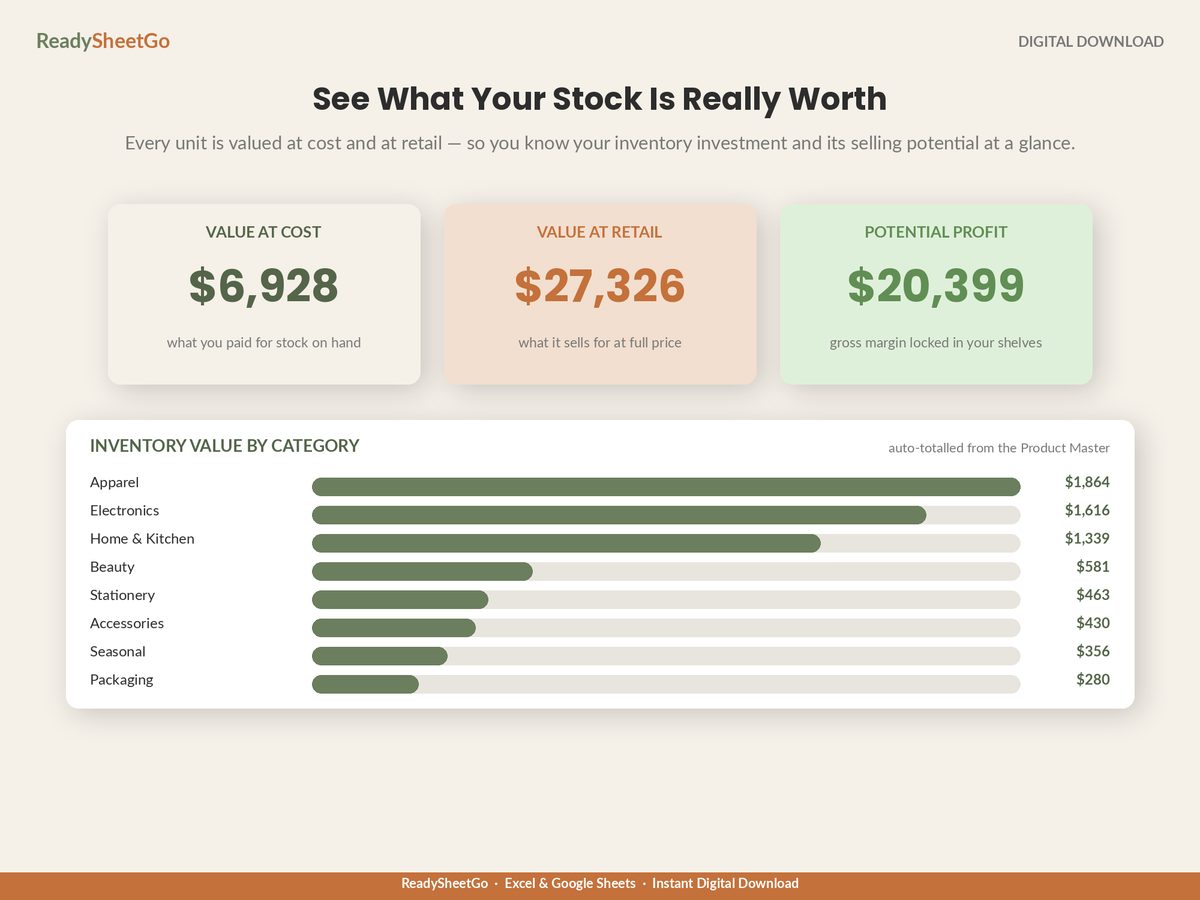
- Allocate shipping by value, not by unit count, when a shipment contains a mix. A box holding $400 of diffusers and $50 of gift boxes should not have its freight split evenly across the units — the diffusers should carry roughly eight-ninths of it.
- Update unit cost when it changes, and note the date. If your supplier’s price rose in June, stock bought before and after genuinely cost different amounts. Small businesses almost universally use the latest cost for everything, which is fine and consistent — just be aware that it slightly restates the value of older stock, and pick one approach rather than switching.
The Ratio the Two Numbers Feed: Inventory Turnover
Valuation is a snapshot. Turnover is the same data with time in it, and it is where the diagnosis happens.
Inventory turnover = annual cost of goods sold ÷ average inventory at cost
Days inventory on hand = 365 ÷ turnover
For the shop above, taking the whole 24-SKU catalogue rather than the eight-line extract:
- Annual COGS: $15,260
- Average inventory at cost: $4,420
- Turnover: 15,260 ÷ 4,420 = 3.45 times a year
- Days on hand: 365 ÷ 3.45 = 106 days
The average item sits for about three and a half months. On its own that number means very little. Broken out by category it means a great deal:
| Category | Annual COGS | Avg inventory @ cost | Turns/yr | Days on hand |
|---|---|---|---|---|
| Soap & bath | $4,340 | $610 | 7.11 | 51 |
| Candles | $6,180 | $1,610 | 3.84 | 95 |
| Textiles | $2,140 | $560 | 3.82 | 96 |
| Ceramics | $1,580 | $940 | 1.68 | 217 |
| Gift packaging | $1,020 | $700 | 1.46 | 250 |
| Whole shop | $15,260 | $4,420 | 3.45 | 106 |
Now the shop-wide 3.45 looks like what it is: an average smeared across two completely different businesses.
Soap turns seven times a year. It converts cash back into cash every seven weeks. If you had another thousand dollars to spend, it should probably go here.
Ceramics turn 1.68 times — 217 days. That is $940 of cash spending seven months on a shelf to produce $1,580 of annual cost of goods. Not necessarily wrong; ceramics may be why people visit. But it is a decision, and it should be a knowing one.
Gift packaging at 1.46 turns is the interesting one, because it is not a product problem — it is an ordering problem. Boxes are cheap and come in large minimums, so somebody bought an enormous quantity at once: at 250 days of average cover, and given that average inventory sits at roughly half an order, the order itself was something like a year and a half of boxes. That is $700 of cash spent to save a few dollars on a case price. Whether that trade was worth it is a real question, and it only becomes visible when you break turnover out by category.
The Comparison to Avoid
The temptation once you have a turnover figure is to search for the industry benchmark and see whether you beat it. Resist it. The spread across retail categories is enormous — you can see it inside your own five categories above, where soap turns more than four times as often as gift packaging in the same shop — and a single “good” number quoted without a category, a source and a year usually describes a business nothing like yours.
The useful comparisons are the two you already own:
- This category against that category, in your own shop. The table above.
- This quarter against last quarter, same category. Direction beats level. Candles falling from 3.84 to 2.9 is a signal worth acting on regardless of what any benchmark says the number should be.
Putting It in the Spreadsheet
Four columns on the product master, two summary cells, and it maintains itself:
| Column | Formula |
|---|---|
| Value @ cost | =on_hand * unit_cost |
| Value @ retail | =on_hand * retail_price |
| Margin % | =(retail_price - unit_cost) / retail_price |
| Potential profit | =value_retail - value_cost |
Then, per category, run a SUMIF on each of the two value columns and divide the category’s annual COGS by its average inventory. If you do not have a true average, take the simple mean of the opening and closing values for the period — it is imprecise and it is close enough to make the category comparison work.
One caution: turnover on a single SKU can be misleading, especially for slow lines and anything seasonal. A product with three units on hand and eleven sold last year shows a very high turnover and may simply be a line that keeps running out. Use turnover at category level for the diagnosis, and use the reorder point calculation at SKU level for the decision.
When One Number Hides the Other
Watch for two patterns the pair will surface that neither figure shows alone.
Cost value flat, retail value falling. You are discounting. The shelf holds the same investment and is capable of producing less revenue than it was. Nothing in a cost-only sheet will ever show this.
Cost value rising, turnover falling. You are buying faster than you are selling. This is the most common way a small business runs out of cash while looking, on paper, like it is growing — the money is not gone, it is on the shelf, and the shelf is getting slower.
Both are visible in ninety seconds a month if the two values and the turnover figure are sitting on a dashboard rather than being recalculated by hand when somebody asks.
The Thing Worth Remembering
Your stock has two honest values, and the gap between them is your gross profit sitting still.
At cost tells you how much of your money is currently unavailable. At retail tells you what that money is capable of becoming. Turnover, especially split by category, tells you how long it will take — and it is almost always the category comparison, not the shop-wide average, that shows you where the cash is stuck.
For the full setup those figures come out of, see how to build a small business inventory spreadsheet with reorder alerts — and for the lines that are dragging your turnover down without ever triggering an alert, how to find dead stock in a spreadsheet.
Featured on ReadySheetGo
Small Business Inventory & Stock Management Tracker — $16.99
Eight ready-built tabs, every formula already written, 24 sample products pre-filled.
Every SKU on the Product Master is valued twice — at cost and at retail — automatically, with gross margin per unit calculated from the two, so an underpriced line shows itself. The Dashboard totals both figures side by side, returns the potential gross profit sitting on your shelves, and breaks inventory value out by category, which is the split that shows you where your cash is actually stuck.
The Sales / Usage Log returns revenue and gross profit per line and draws stock down automatically, giving you the cost-of-goods figure a turnover calculation needs. Stock Movements keeps on-hand current from every stock-in and stock-out. Purchase Orders track what is on order and what it will cost. And a live reorder-point status per product flags OK, REORDER NOW or OUT OF STOCK, alongside a dead-stock flag for the products that never move.
Works in Excel, Google Sheets and Apple Numbers. No macros, no add-ons, no subscription.
Get the Small Business Inventory & Stock Management Tracker →
Frequently Asked Questions
Is inventory valued at cost or at retail?
For your accounts, at cost — that is the figure that goes on the balance sheet and drives cost of goods sold. For running the business, you want both. Cost tells you how much of your money is currently sitting on a shelf; retail tells you how much revenue that shelf is capable of producing. They answer different questions, and a shop that only tracks one of them cannot tell whether it can afford next month's order or whether it has enough stock to hit next month's target.
What is a good inventory turnover ratio for a small business?
It varies so much by category that a single benchmark is close to useless, and you can see the spread inside one shop: in the worked example here, soap turns 7.11 times a year while gift packaging turns 1.46. The number worth watching is your own, tracked over time and broken out by category. If one category turns 7 times a year and another turns 1.5, the second one is where your cash is stuck, and that comparison is far more actionable than measuring yourself against an industry average that may not describe your business at all.
How do I calculate days inventory on hand?
Divide 365 by your inventory turnover ratio. If your turnover is 3.45, days on hand is 106 — meaning the average item sits for about three and a half months before selling. Days on hand is usually the more intuitive of the two figures because it converts an abstract ratio into a length of time, and a category sitting at 250 days is obviously a problem in a way that 'turns 1.46 times' is not.
Should shipping and duty be included in unit cost?
Yes. Landed cost — supplier price plus inbound shipping, duty and any handling, divided across the units received — is the only figure that values your stock honestly. If a case of 24 soaps costs $46 plus $5.60 shipping, the unit cost is $2.15, not $1.92. The 23-cent difference is invisible per unit and material across a year, and using the invoice price alone quietly overstates your margin on every single line.