Small Business Inventory Spreadsheet With Reorder Alerts: The Complete Setup
There are two questions a small business gets asked constantly and usually cannot answer on the spot.
How much stock have you got? — meaning the dollar figure, not the vibe.
Full walkthrough of the template used in this guide.
What do you need to reorder? — meaning right now, before Friday’s order deadline, not after a customer tells you the thing they wanted is gone.
Both are answerable from one sheet. Neither is answerable from the sheet most small businesses actually keep, which is a product list with a quantity column that somebody last updated in the spring.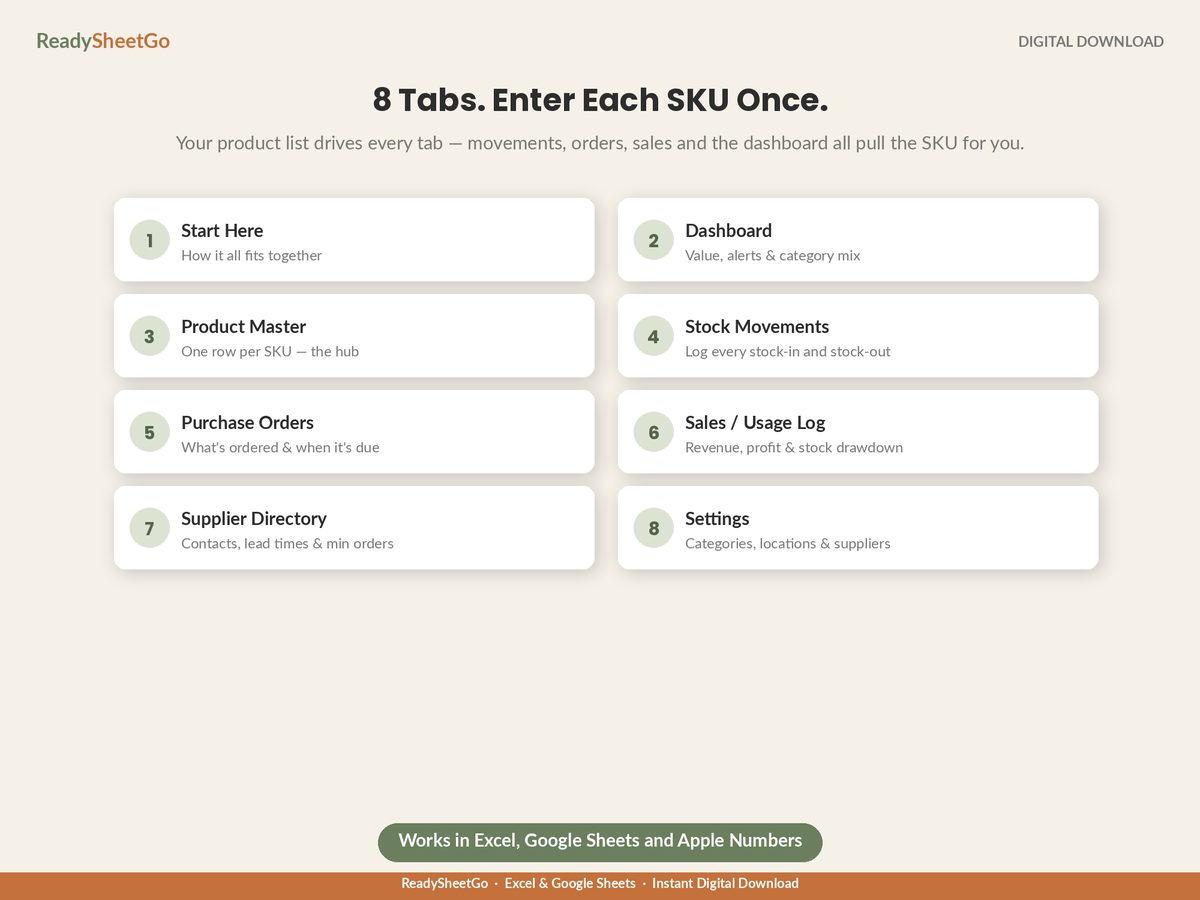
Here is what the difference looks like. This is eight lines from a 24-SKU gift shop — a made-up shop, but the arithmetic is the arithmetic:
| SKU | Product | Cost | Retail | On hand | Reorder pt | Status | Value @ cost | Value @ retail |
|---|---|---|---|---|---|---|---|---|
| CAN-LAV-8 | Lavender candle 8oz | $6.40 | $22.00 | 12 | 20 | REORDER NOW | $76.80 | $264.00 |
| CAN-CED-8 | Cedar candle 8oz | $6.40 | $22.00 | 48 | 20 | OK | $307.20 | $1,056.00 |
| SOP-OAT-BAR | Oat & honey soap | $2.15 | $9.00 | 0 | 24 | OUT OF STOCK | $0.00 | $0.00 |
| MUG-STO-12 | Stoneware mug 12oz | $7.80 | $26.00 | 34 | 12 | OK | $265.20 | $884.00 |
| TWL-LIN-SET | Linen tea towel set | $9.25 | $32.00 | 6 | 10 | REORDER NOW | $55.50 | $192.00 |
| DIF-REED-100 | Reed diffuser 100ml | $11.50 | $38.00 | 19 | 8 | OK | $218.50 | $722.00 |
| GFT-BOX-SM | Small gift box | $1.35 | $5.00 | 210 | 60 | OK | $283.50 | $1,050.00 |
| ORN-BRASS-STAR | Brass star ornament | $4.90 | $18.00 | 61 | 10 | OK | $298.90 | $1,098.00 |
| These eight lines | $1,505.60 | $5,266.00 |
Three of the eight columns are typed. Five calculate themselves. And the sheet has already told you four things you would otherwise have found out the hard way: the soap has run out, two more lines are about to, there is $1,505.60 of your money sitting in these eight products, and $298.90 of it is in a brass ornament that has not sold a single unit in ninety days.
That last one is the expensive part, and it is the part a quantity column can never show you.
The Six Fields Everything Else Is Built From
You do not need thirty columns. You need six typed fields per product, and the rest is arithmetic.
1. SKU. A short code that never changes, even if the product name does. CAN-LAV-8 survives being renamed from “Lavender Candle” to “Lavender & Sage Candle” to “Signature Lavender”. A product name does not, and every formula pointed at it breaks silently. Three parts is plenty: category, item, variant.
2. Unit cost. What one unit costs you landed — the supplier price plus inbound shipping and any duty, divided across the units in the shipment. Not the price on the invoice line. If a case of 24 soaps costs $46 plus $5.60 shipping, your unit cost is $2.15, not $1.92. The 23-cent gap is invisible per unit and about $140 across a year of soap at this shop’s rate — and, worse, it overstates your margin on every single line forever.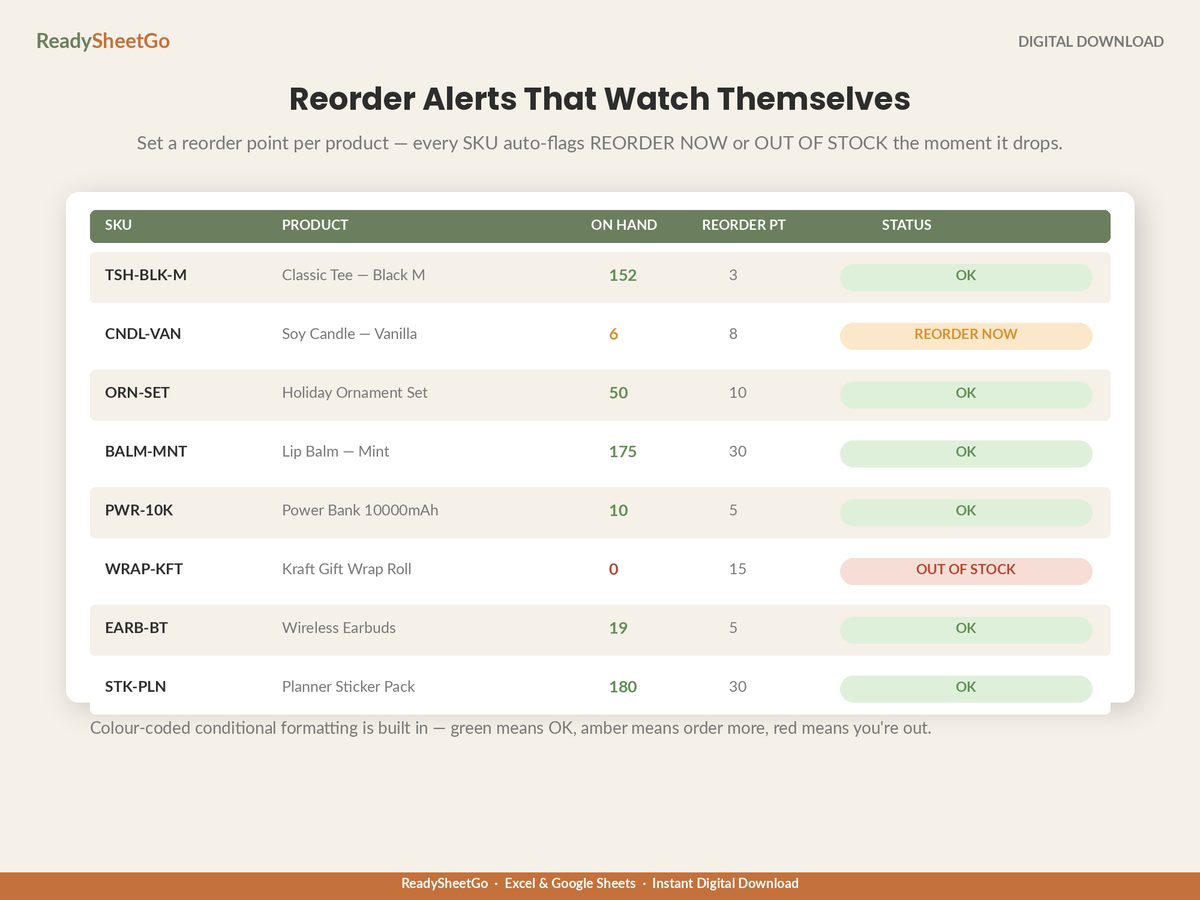
3. Retail price. What you sell it for. This is what makes the second valuation possible.
4. Quantity on hand. Calculated, not typed — see the next section.
5. Reorder point. The quantity at which you must order to avoid running out. This is a real calculation, not a round number you picked, and it is the single most valuable cell in the file. How to work it out from your own sales rate and your supplier’s lead time is the one piece of arithmetic worth doing properly.
6. Supplier and lead time. Days between placing an order and having it on the shelf, measured from your own past orders rather than what the supplier’s website claims. The reorder point is built out of this number, so a wrong lead time makes every alert in the file wrong by the same margin.
From those six, the sheet returns margin per unit, stock status, value at cost, value at retail, and the potential gross profit sitting on your shelves. None of those need typing.
On-Hand Has to Be Calculated, Not Typed
This is the change that turns a list into a tracker, and it is the one people resist because typing a number feels faster.
If on-hand is typed, every update destroys the previous one. You count the shelf in March, find 12 candles where the sheet says 19, type 12 over the top, and the seven-unit discrepancy vanishes from the record forever. Next time it happens you have no idea whether it is a pattern.
Instead, keep a stock movement log — one dated row per event:
| Date | SKU | Type | Qty | Location | Note |
|---|---|---|---|---|---|
| 12 Aug | CAN-LAV-8 | Stock in | +36 | Studio | PO-0114 received |
| 19 Aug | CAN-LAV-8 | Stock out | −18 | Studio | Online orders wk 34 |
| 24 Aug | CAN-LAV-8 | Stock out | −4 | Market stall | Fall craft fair |
| 02 Sep | CAN-LAV-8 | Adjustment | −2 | Studio | Damaged in transit |
On hand is then opening quantity, plus everything in, minus everything out. In a spreadsheet that is a single SUMIFS per SKU, and it gives you three things a typed number cannot:
- A traceable history. Any discrepancy can be walked back to the week it appeared.
- Adjustments as a visible category. Breakage, samples, personal use and theft stop hiding inside “sales”. If your adjustments column totals $340 for the year, that is a number you can act on. Buried in a retyped quantity, it is nothing at all.
- Multi-location support for free. Add a location column and the same log tells you what is in the studio, what is at the market stall and what is in the storage unit, without three separate files that disagree.
The Reorder Alert Is Two Cells and a Colour
Everyone wants the sheet to “alert” them. In practice the alert is a status column and conditional formatting, and it works because you look at the file before you place an order anyway.
The logic:
- On hand = 0 →
OUT OF STOCK(red) - On hand ≤ reorder point →
REORDER NOW(amber) - Anything else →
OK(green)
In Excel or Google Sheets: =IF(D2=0,"OUT OF STOCK",IF(D2<=E2,"REORDER NOW","OK")), with D as on hand and E as the reorder point. Then Conditional Formatting → Format cells if text is exactly REORDER NOW → amber fill, and the same for the other two.
Add a filter or a sort on that column and your purchase order writes itself: filter to REORDER NOW and OUT OF STOCK, group by supplier, and you have the week’s ordering in front of you in about forty seconds. The dashboard count — 2 low, 1 out across the eight lines above — is a COUNTIF on the same column.
The alert is only as good as the reorder point behind it, though, and that is where nearly every sheet falls down. In the table above, the lavender candle’s reorder point of 20 was a guess. Its real reorder point, worked out from a sales rate of 1.07 units a day and an 18-day supplier lead time, is 33. The sheet was going to let it run out and then flag it — which is a smoke alarm that goes off after the fire.
Value It Twice: At Cost and At Retail
Most inventory sheets total one column. There is a reason to total two.
At cost is your money. It is what you have spent that is currently sitting on a shelf instead of in your bank account, and it is the figure your accountant needs at year end for the balance sheet and for cost of goods sold.
At retail is what that stock is capable of turning into. The gap between the two is the gross profit locked up in your shelves — $3,760.40 across the eight lines above, or 71.4% of the retail value.
You need both because they answer different questions. “Can I afford to place a $900 order this month?” is a cost question. “Is there enough stock in the building to hit a $4,000 month?” is a retail question. A shop that only tracks one of them will over-order or under-order, and will not know which it did until the money is already gone.
Broken out by category, the same two numbers start diagnosing the business rather than just describing it. What inventory value and turnover actually tell you, and how to work out both covers the calculation and the ratio it feeds.
The Products That Never Move
Look at the brass star ornament again. On hand 61, status OK, $298.90 at cost. It is not low, it is not out, so no alert will ever fire on it. It has also sold zero units in ninety days.
Every reorder alert in the world points at the fast movers. Nothing points at this, and this is where small businesses quietly lose money — not on the thing that ran out, but on the thing that never left. Against the shop’s $4,420 of average stock at cost, that $298.90 is 6.8% of the entire stock investment, permanently unavailable for buying products that do sell.
The fix is a second flag alongside the reorder status: days since last movement, and anything over 90 gets marked. How to find dead stock in a spreadsheet and decide what to do about each line walks through the flag and the four exits.
The Stocktake: How to Reconcile the Sheet to the Shelf
Here is the part to actually do, because a beautiful spreadsheet that disagrees with the shelf is worse than no spreadsheet — it makes confident, wrong decisions.
Count on a rotation, not all at once. Full counts once or twice a year; cycle counts weekly. Split your SKU list into thirteen groups, count one group a week, and every product gets counted four times a year without ever closing for a day. Weight the rotation toward your highest-value and fastest-moving lines — count those monthly, count the gift boxes twice a year.
The five-step count:
- Freeze the SKU. Do not sell, pick or receive that product while you are counting it. For a small shop that means counting before opening or after closing; if something must move mid-count, write it on a slip and enter it after.
- Count blind. Print or open a count sheet with SKU, product and location, and no expected quantity. If the counter can see that the sheet says 34, the count comes out 34. Blind counting is the entire difference between a stocktake and a confirmation exercise.
- Count every location. Shop floor, back room, the box under the desk, the market stall crate, goods received but not yet put away. Uncounted locations are the most common source of a “missing” unit that was never missing.
- Enter the count and let the sheet do the subtraction. Expected on hand minus counted quantity is your variance, in units and in dollars. Sort by dollar variance, not unit variance — twelve missing gift boxes is $16.20; three missing diffusers is $34.50, and the second one matters more.
- Post an adjustment, do not overwrite. Every variance goes into the movement log as a dated adjustment row with a reason. That is what makes shrinkage a trend you can read at year end rather than a number you retype away four times a year.
Reading the variances. A scatter of ±1s across cheap, fast-moving lines is normal counting noise. What is worth chasing: the same SKU short every single count (a picking or listing error, or a genuine loss), a large one-off (usually a receipt never logged, or a wholesale order shipped without being recorded), and consistent overs (nearly always a stock-in entered twice, or a return that came back without a movement row).
When a Spreadsheet Stops Being Enough
Honest answer: for one location, a few hundred SKUs and one or two people touching stock, a spreadsheet does the job, and does one thing the software often does badly — it lets you see and change the arithmetic.
It stops being enough at fairly specific thresholds: several people editing at once, barcode scanning at the point of sale, live syncing across sales channels so the online shop cannot sell what the market stall already sold, or a SKU count in the thousands. The five thresholds that decide it, and the break-even on what software costs you is the comparison to run before subscribing to anything.
Set It Up in Thirty Minutes
- Settings first. List your categories, your storage locations and your suppliers with lead times. These feed every dropdown in the file, so doing them first saves re-typing later.
- Product master. One row per SKU: code, name, category, supplier, unit cost landed, retail price, opening quantity, reorder point. Twenty-four products takes about fifteen minutes. Do not try to be complete on day one — enter your top sellers, get the file working, add the tail later.
- Add the three calculated columns. Status, value at cost, value at retail. Format the status column with the three colours.
- Start the movement log the same day. Every stock-in from a purchase order, every stock-out from a sale, every adjustment from breakage. The log is only useful if it starts immediately; a log that begins in November cannot explain October.
- Put a count in the calendar. First Monday of the month, one group of SKUs. Twenty minutes.
The Thing Worth Remembering
An inventory list tells you what you typed. An inventory tracker tells you what to do — which is a difference of about five formulas.
Reorder points turn a quantity into a decision. Two valuations turn a shelf into a balance sheet and a sales forecast. A movement log turns a discrepancy into something traceable. A dead-stock flag points at the money nothing else in the file is looking at.
And a count, done blind, on a rotation, is what keeps all four honest.
Featured on ReadySheetGo
Small Business Inventory & Stock Management Tracker — $16.99
Eight ready-built tabs with every formula already written and tested, and 24 sample products pre-filled so you can see it working before you type a thing.
Settings holds your categories, storage locations and suppliers, and feeds the dropdowns everywhere else. The Product Master is one row per SKU and the hub of the whole file — it returns margin, on-hand quantity, value at cost, value at retail and a live status against the reorder point you set per product, so every line flags itself OK, REORDER NOW in amber, or OUT OF STOCK in red the moment it crosses the line. Stock Movements logs every stock-in and stock-out with multi-location support, and on-hand recalculates instantly. Purchase Orders tracks what was ordered, what each line cost, when it is due and whether it arrived. The Sales / Usage Log returns revenue and gross profit per line and draws the stock down automatically. The Supplier Directory holds contacts, lead times and minimum order quantities — the figures a reorder point is built from.
The Dashboard returns total inventory value at cost and at retail side by side, the potential gross profit sitting on your shelves, units on hand, low-stock and out-of-stock counts, open purchase orders, a dead-stock flag for products that never move, and inventory value broken out by category.
Nothing is password-locked — it is your file, restructure it however you like. Works in Excel, Google Sheets and Apple Numbers. No macros, no add-ons, no subscription.
Get the Small Business Inventory & Stock Management Tracker →
Frequently Asked Questions
What should a small business inventory spreadsheet actually track?
Six things per product, and everything else is optional: a SKU that never changes, unit cost, retail price, quantity on hand, a reorder point, and the supplier's lead time. Those six generate every number that matters — stock status, value at cost, value at retail, gross margin per unit and the date you should be placing the next order. A sheet that tracks a description and a quantity and nothing else is a list, not a tracker: it cannot tell you anything you did not already type into it.
How do I make a spreadsheet alert me when stock is low?
Put a reorder point column next to the on-hand column and write a status formula that compares them — on hand of zero returns OUT OF STOCK, on hand at or below the reorder point returns REORDER NOW, anything above returns OK. Then apply conditional formatting to the status column so red and amber appear on their own. The alert is not a notification; it is a cell that changes colour the moment the on-hand figure crosses a line you set per product. That is enough, because you look at the sheet before you place an order anyway.
Should on-hand quantity be typed in or calculated?
Calculated. If you type on-hand directly, every correction overwrites the history and you can never answer why a number moved. Log stock-ins and stock-outs as dated rows in a movement log instead, and let on-hand be opening quantity plus everything in minus everything out. You lose nothing, and you gain the ability to trace any discrepancy to the week it appeared — which is the only way a shrinkage number ever becomes actionable.
How often should I do a physical stock count?
Full counts once or twice a year, and rolling cycle counts on a rotation the rest of the time — a handful of SKUs each week so every product is counted a few times a year without ever closing the shop for a day. Count your highest-value and fastest-moving lines most often, because that is where a discrepancy costs the most and appears the soonest. The count is what keeps the spreadsheet honest; without it, the file drifts from the shelf and every reorder decision inherits the error.