How to Calculate a Reorder Point for Your Inventory (With a Worked Example)
The soap sold out on a Tuesday.
Not because it was unexpectedly popular — it sells about the same amount every week — but because the reorder point in the spreadsheet was 24, and 24 was a number somebody picked because it was one case.
Full walkthrough of the template used in this guide.
By the time the sheet flagged it, there were about fourteen days of supply left at the soap’s average rate — and ten days at the rate it was actually selling that month. The supplier needed twelve. Any hiccup at all, and there was one because there always is, meant a fortnight with nothing to sell.
That is not an inventory problem. It is an arithmetic problem, and it takes about ten seconds per product to fix.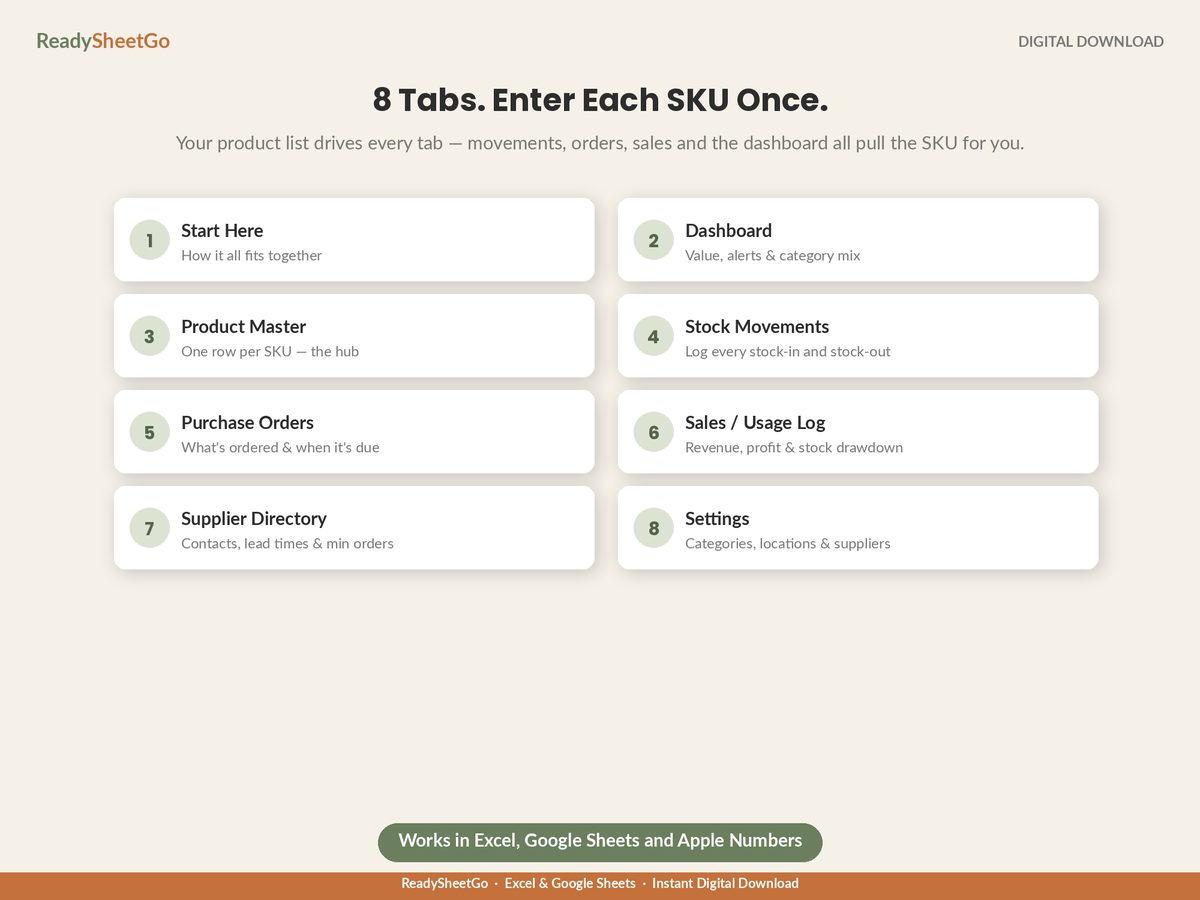
The Formula
Reorder point = (average daily sales × lead time in days) + safety stock
Two parts, and each one answers a separate question.
Part one — cycle stock — answers: how much will I sell while the order is on its way? If you sell one a day and the supplier takes 18 days, you will sell 18 units between placing the order and receiving it. If you place the order with fewer than 18 units on the shelf, you run out before it lands. That is not bad luck; that is subtraction.
Part two — safety stock — answers: what if this fortnight is busier than usual, or the delivery is late? Average daily sales means you are above average roughly half the time. A reorder point built on the average alone sells out about half the time by design. Safety stock is what buys the margin back.
Most shops calculate neither and set the reorder point to whatever a case holds.
Worked Example: The Lavender Candle
Real inputs, straight out of a sales log — all figures here are from a made-up 24-SKU gift shop, but the method is the point.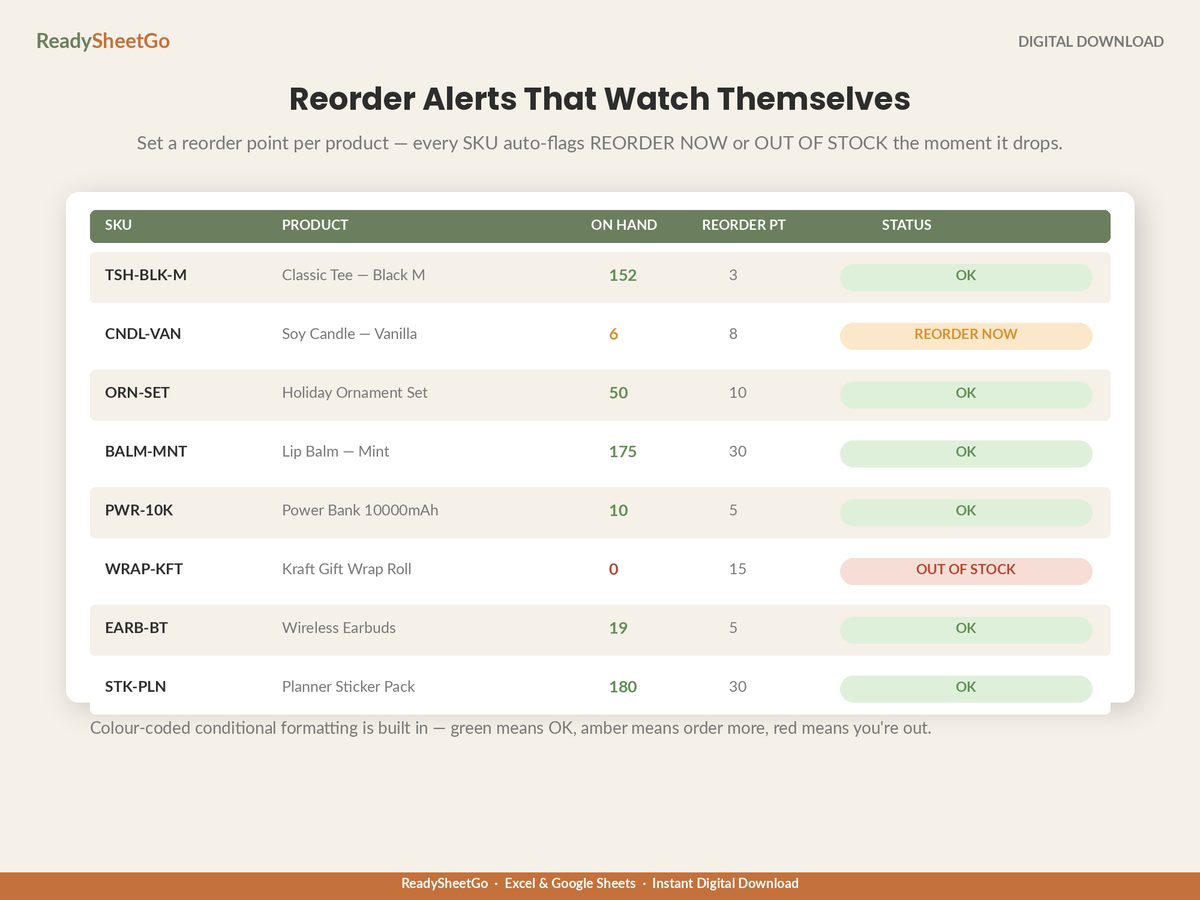
| Input | Value | Where it comes from |
|---|---|---|
| Units sold, last 90 days | 96 | Sales log, filtered to this SKU |
| Average daily sales | 96 ÷ 90 = 1.07/day | Calculated |
| Busiest 30-day stretch | 54 units = 1.80/day | Sales log, best month |
| Supplier lead time | 18 days | Last three POs, order date to shelf date |
| Reorder point currently set to | 20 | Somebody’s guess |
Cycle stock: 1.07 × 18 = 19.2 units — what sells while the order travels.
Safety stock: (1.80 − 1.07) × 18 = 13.2 units — what a genuinely busy fortnight consumes on top of average.
Reorder point: 19.2 + 13.2 = 32.4 → round up to 33.
The reorder point was 20. It should be 33. That gap is not a rounding difference — it is the difference between ordering on time and ordering thirteen units too late, every single cycle.
And the sheet in question had 12 units on hand. At 1.07 a day, that is 11 days of cover against an 18-day lead time. The candle was already going to run out for a week before the order arrived, and the file was still showing amber rather than red, because amber was measured against a number somebody guessed.
Why the Round Number Always Loses
Run the same formula on a second product and the reason becomes obvious.
Oat & honey soap: 148 units in 90 days (1.64/day), busiest month 72 units (2.40/day), supplier lead time 12 days.
- Cycle stock: 1.64 × 12 = 19.7
- Safety stock: (2.40 − 1.64) × 12 = 9.1
- Reorder point: 29
Two products in the same shop, both previously set to “about 20”, and the correct answers are 33 and 29 — landing in a similar neighbourhood but arrived at from completely different directions. The candle needs a high reorder point because the supplier is slow. The soap needs one because it sells fast. Similar numbers, opposite causes.
Now do a third: a stoneware mug selling 22 units in 90 days (0.24/day), busiest month 14 units (0.47/day), from a local supplier with a 5-day lead time. Cycle stock 1.2, safety stock 1.1, reorder point 3. That mug’s reorder point in the sheet was 12 — a number picked because it is a dozen. Holding 12 when 3 will do means nine surplus mugs sitting there permanently, about five weeks of extra cover on a line that sells one every four days, with the cash to match.
One round number applied across a catalogue does both kinds of damage at once: it starves the fast lines and it drowns the slow ones.
Getting the Lead Time Right
Lead time is the input that quietly wrecks the calculation, because people use the number the supplier advertises rather than the number the supplier delivers.
Measure it yourself, from your own purchase order records: the date you placed the order to the date the stock was actually available to sell. Not the date it shipped. Not the date it arrived at the door. The date it was counted in, put away and sellable — because a box in the hallway does not fill orders.
Take your last three or four orders from that supplier and use the longest one, not the average. Lead times are asymmetric: they are occasionally much longer than usual and almost never much shorter. Planning on the average means being caught out by every slow delivery, and slow deliveries are the whole reason safety stock exists.
Two further adjustments worth making:
- Add your own processing time. If orders sit for two days before you place them because you order on Fridays, your effective lead time is two days longer than the supplier’s.
- Add minimum order quantities into the decision, not the formula. If the supplier’s minimum is a case of 36 and your reorder point is 33, you are fine. If your reorder point is 33 and the minimum is 144, the reorder point is correct and the supplier is the problem — that is a conversation about case-breaking or a second source, not a reason to fudge the number.
Putting It in the Spreadsheet
Four columns and the whole thing maintains itself.
| Column | Formula | Notes |
|---|---|---|
| Avg daily sales | =SUMIFS(sales_qty, sales_sku, A2, sales_date, ">="&TODAY()-90)/90 |
90 days is a good default window |
| Lead time (days) | typed | From the supplier directory, measured not advertised |
| Safety stock | =(peak_daily - avg_daily) * lead_time |
Peak from your busiest 30-day stretch |
| Reorder point | =ROUNDUP(avg_daily*lead_time + safety_stock, 0) |
Always round up |
Then the alert that reads it: =IF(on_hand=0,"OUT OF STOCK",IF(on_hand<=reorder_point,"REORDER NOW","OK")), with conditional formatting so the amber and red appear on their own.
Two cautions worth building in:
Watch the window. A 90-day average calculated in January includes December, and December is not January. For seasonal products, use the same period from last year instead, or calculate the average from a comparable stretch. A reorder point that inherits Christmas will have you buying ornaments in February.
Round up, always. ROUNDUP rather than ROUND. The cost of being one unit high is a few dollars of tied-up cash. The cost of being one unit low is a stockout, and a stockout costs the margin on every sale you did not make, plus the customer who bought it elsewhere.
Recalculate Quarterly, and Whenever the Inputs Move
Reorder points are not set-and-forget. Two triggers:
On a schedule — quarterly. Sales rates drift. A line that sold 0.3 a day last spring may be at 1.1 now, and its reorder point is still sized for the old rate.
On an event — immediately. A supplier changes lead time, a product features somewhere and demand jumps, a season starts. These are the moments the formula is most wrong and least likely to be checked.
The quarterly pass takes ten minutes if the sales log is already in the file, because every input is a formula reading data you are entering anyway.
The Thing Worth Remembering
A reorder point is not a stock level you are comfortable with. It is the answer to a specific question: how much will I sell before the replacement arrives, plus how wrong could I be?
Answer it per product, with your own sales rate and your own measured lead time, and the alerts in your spreadsheet start firing early enough to be useful. Set every product to the same round number and you will keep running out of the fast lines while your cash sits in the slow ones — which is exactly what most inventory sheets are doing right now.
Once the reorder points are right, the rest of the file follows: the full setup for a small business inventory spreadsheet with reorder alerts covers the movement log, the two valuations and the stocktake that keeps the numbers honest.
Featured on ReadySheetGo
Small Business Inventory & Stock Management Tracker — $16.99
Eight ready-built tabs, every formula already written, 24 sample products pre-filled.
You set a reorder point per product on the Product Master and every SKU flags itself against its own on-hand quantity — OK, REORDER NOW in amber, or OUT OF STOCK in red — with the dashboard counting the low and out-of-stock lines for you. The Supplier Directory holds contacts, lead times and minimum order quantities, so the number your reorder point is built from lives in the file rather than in your head. The Stock Movements log keeps on-hand current automatically from every stock-in and stock-out, and the Sales / Usage Log gives you the sales history the average-daily-sales figure comes out of.
Alongside those: Purchase Orders with line totals and placed-to-received status, dual valuation of every SKU at cost and at retail, a dead-stock flag for products that never move, and a Dashboard returning total value, potential profit, units on hand, alert counts and inventory value by category.
Works in Excel, Google Sheets and Apple Numbers. No macros, no add-ons, no subscription.
Get the Small Business Inventory & Stock Management Tracker →
Frequently Asked Questions
What is the reorder point formula?
Reorder point = (average daily sales × lead time in days) + safety stock. The first part covers what you will sell while the order is in transit. The second covers the weeks that run hotter than average and the deliveries that run late. Leave out the safety stock and you have built a system that sells out roughly half the time by design, because average demand means you are above it half the time.
How do I calculate safety stock without a statistics degree?
Take your busiest recent 30-day stretch, convert it to a daily rate, and subtract your average daily rate. Multiply the difference by the lead time. That gives you the extra units a genuinely busy period would consume while you wait for the order. It is a rough method and it is meant to be — it uses only numbers you already have, and it is far closer than the round number most shops use instead.
Should every product have a different reorder point?
Yes, and this is the main reason gut-feel reorder points fail. A product selling 1.64 units a day from a supplier with a 12-day lead time needs a reorder point around 29. A product selling 0.24 a day with a 5-day lead time needs 3. Setting both to a round 20 because 20 feels sensible means the first sells out and the second ties up cash for months. The formula takes about ten seconds per SKU once your sales data is in a sheet.
How often should I recalculate reorder points?
Quarterly for most products, and immediately whenever a supplier's lead time changes or a product's sales rate shifts noticeably — a line going viral, a seasonal peak arriving, a supplier moving production. The lead time is the input that changes without warning and the one people forget to update, so measure it from your own recent purchase orders rather than trusting the figure on the supplier's site.