How to Calculate R-Multiple and Expectancy in a Trading Journal
Two traders show you their month. One made $4,100. The other made $2,300.
You know nothing. Not who traded better, not which approach you’d rather run, not whether either result is repeatable — because dollars are a function of account size, position size and how many times someone pressed the button. R-multiples strip all three out, and expectancy turns the stripped-down version into a single number you can act on.
Here are the four formulas, worked on a real 51-trade record.
Formula 1: Initial Risk
Everything starts here, and it’s typed at entry rather than derived at exit.
Initial risk = |entry price − planned stop| × quantity × contract multiplier
Three things to get right.
The planned stop, not the actual exit. This is the whole trick and the place people break it. If you use the price you got out at, every losing trade comes out at exactly −1.00R and the column carries no information at all. The stop has to be the one you decided on before the trade did anything, which means it has to be typed into the row at entry.
The multiplier. A standard US equity option is ×100. Futures contracts each have their own. Get this wrong on one row and that row’s R is off by two orders of magnitude, which will visibly wreck any average it lands in.
Trades with no planned stop have no R. Not zero — blank. A long-term hold with no stop, or a defined-risk options position where the structure caps the loss, belongs in the dollar statistics and out of the R statistics. Forcing an R onto it produces a number that means nothing and quietly poisons the average.
Worked, on a stock trade: buy 200 shares at $48.20, planned stop $46.70.
|48.20 − 46.70| × 200 × 1 = $1.50 × 200 = $300.00
That $300 is what you agreed to lose. Every result on that row gets measured against it.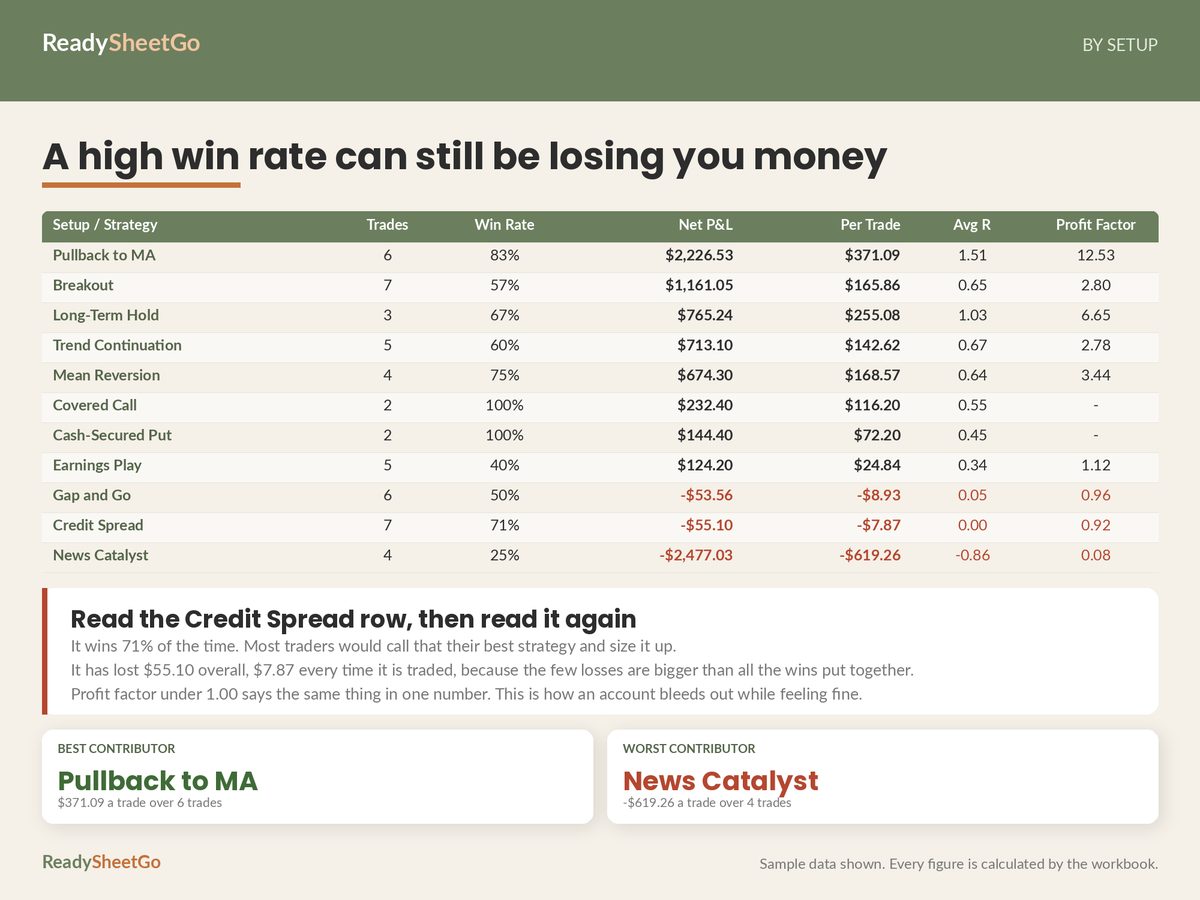
Formula 2: R-Multiple
R-multiple = net result after fees ÷ initial risk
Net, not gross. Fees come out first, or your R column is optimistic by exactly the amount your broker charges.
Same trade, three ways it could end:
| Exit | Net after fees | ÷ risk | R |
|---|---|---|---|
| $50.35 | +$420.00 | ÷ $300 | +1.40R |
| $46.70 (stop hit) | −$302.00 | ÷ $300 | −1.01R |
| $45.90 (gapped through) | −$462.00 | ÷ $300 | −1.54R |
The third row is the one worth noticing. In dollars it’s “a bad day.” In R it’s a loss that was 54% larger than the one you signed up for — a different kind of event from row two, and one you’d want to count separately.
In a spreadsheet, guard the division. If initial risk is blank or zero the formula has to return blank rather than a division error, or one un-stopped row breaks every cell that reads the column. =IF(N(risk)=0,"",net/risk) is the shape of it.
Formula 3: Expectancy in Dollars
Expectancy answers one question: what has one trade of this kind been worth to you on average, winners and losers together?
Expectancy = (win rate × average win) − (loss rate × average loss)
with average loss entered as a positive number.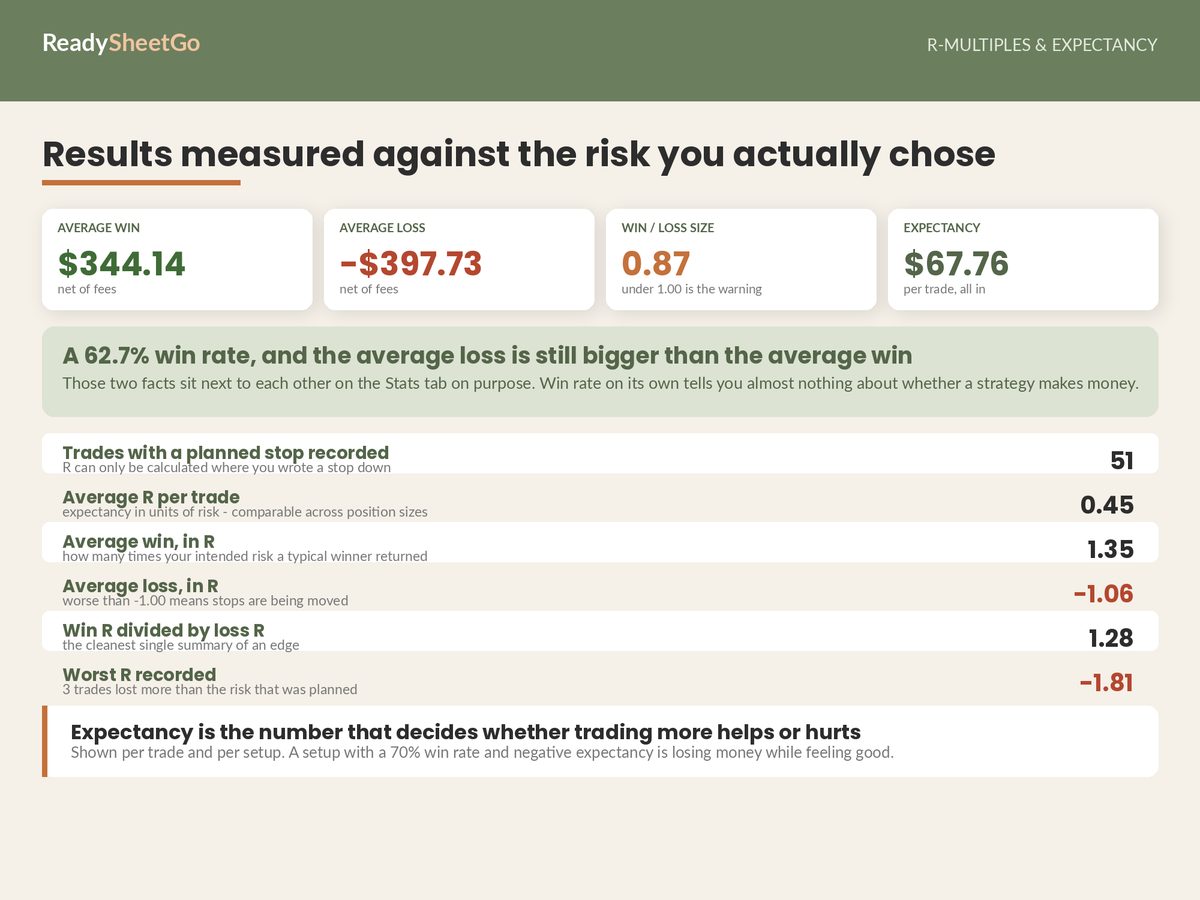
The worked account — 51 closed trades, illustrative figures from the Options, Stock & Futures Trading Journal sample data:
- Win rate: 62.7% (32 wins)
- Loss rate: 37.3% (19 losses)
- Average win: $344.14
- Average loss: $397.73
(0.627 × $344.14) − (0.373 × $397.73)
= $215.94 − $148.18
= $67.76 per trade
Check it against the total: 51 × $67.76 = $3,455.76, against a net P&L of $3,455.53. It ties.
And look at what the calculation exposes on the way past. The average loss is larger than the average win — $397.73 against $344.14, a win/loss ratio of 0.87. This account is profitable purely because it wins often. That’s a legitimate way to trade and it’s also a specific dependency: the win rate is carrying everything. Set win rate to 55% with the same average win and loss and expectancy falls to $10.28. At 52% it’s −$11.96. The account is eleven percentage points of win rate away from being a losing account, and no single dashboard figure says so.
That sensitivity is the most useful thing expectancy gives you, and you get it for free by keeping average win and average loss as separate cells instead of netting them.
Formula 4: Expectancy in R
Same structure, R instead of dollars.
Expectancy (R) = (win rate × average win R) − (loss rate × average loss R)
The same account:
- Average win R: +1.35
- Average loss R: −1.06
(0.627 × 1.35) − (0.373 × 1.06)
= 0.849 − 0.395
= +0.45R per trade
Every trade in this record has been worth about 0.45 times whatever was risked on it. That single sentence is portable in a way “$67.76” is not — it holds whether the account is $28,000 or $280,000, whether the trades are 200 shares or 20 contracts. It’s also what makes the figure comparable to your own record from last year, when your position sizes were different.
The Reading That Matters Most: Average Loss R
Of the four numbers above, the one to check every month is average loss R.
A loss taken at the planned stop is −1.00R by definition. That’s what the stop is. So the theoretical floor for average loss R is −1.00, and any record sitting meaningfully below it is telling you something concrete.
This account sits at −1.06R.
Six percent over. In isolation that’s a rounding error. Across 19 losses averaging $397.73 each, it’s about $428 — roughly 12% of the year’s entire net profit, spent on positions you had already decided to exit.
There are two causes and they need different responses:
Slippage and gaps. The stop was honoured, the fill was worse than the level. Overnight gaps, thin markets, fast opens. Not a discipline problem — a sizing and instrument-selection problem. If it’s concentrated in one instrument or one time block, the Behaviour breakdown will show it.
Stops that moved. The level was widened while the trade was open, usually with a reason that was persuasive at the time. This is a discipline problem, and it’s why the “did you take the planned stop?” column exists on the same row.
You separate the two by tagging losers as gapped or not. Do that once and the average splits into a number you can trade around and a number you can fix, instead of one number you can only feel bad about.
Putting the Columns Together
A journal that computes all of this needs six columns beyond the mechanical record:
| Column | Source | Formula |
|---|---|---|
| Planned stop | typed at entry | — |
| Contract multiplier | from instrument | lookup |
| Initial risk $ | derived | \|entry − stop\| × qty × mult |
| Net result | derived | gross − fees |
| R-multiple | derived | net ÷ risk, guarded for blank risk |
| Rule followed? | typed at exit | yes/no |
From those six, every figure on this page falls out — plus the same set repeated per setup, which is what turns “my expectancy is +0.45R” into “three of my nine setups are negative and here’s what each one costs me per trade.” The full field list and the review loop that uses it is in the main guide.
One last caution on sample size. Expectancy computed over eight trades is a story, not a statistic — a single outlier moves it further than a whole quarter of ordinary results. Set a minimum sample size, mark anything below it provisional, and let small samples change what you watch rather than what you risk.
Featured on ReadySheetGo
Options, Stock & Futures Trading Journal — every formula on this page is already written. Initial risk, R-multiple and net-after-fees derive per row, guarded so an un-stopped trade returns blank instead of an error; the Stats tab returns average win R, average loss R, average R, expectancy in both dollars and R, worst R and a count of trades that finished past their stop; and the By Setup tab repeats all of it per strategy so you can see which ones carry positive expectancy and which don’t. Contract multipliers are set per instrument in Settings and checked against the row, so an options trade logged as ×1 gets flagged rather than silently averaged in. 11 tabs, 5,948 formulas, 51 closed sample trades to read before you clear them. Excel and Google Sheets, no macros. Instant digital download — $17.99.
Illustrative figures only, from sample data. Not financial, investment or tax advice. Trading involves risk of loss.
Frequently Asked Questions
What is the formula for R-multiple?
R-multiple = net result after fees ÷ initial risk, where initial risk = |entry price − planned stop| × quantity × contract multiplier. A trade that netted $420 on $300 of planned risk is +1.40R. The planned stop has to be the one you set before entry — using the price you actually exited at makes every trade come out at exactly −1.00R or +something, which tells you nothing.
How do you calculate expectancy per trade?
Expectancy = (win rate × average win) − (loss rate × average loss, as a positive number). With a 62.7% win rate, average win $344.14 and average loss $397.73: (0.627 × 344.14) − (0.373 × 397.73) = $215.94 − $148.18 = $67.76 per trade. In R terms, use average win R and average loss R the same way and you get expectancy in R, which is comparable across accounts of any size.
What does an average loss of more than 1R mean?
It means your losers are finishing worse than the stop you planned for them. A loss taken exactly at the planned stop is −1.00R by definition, so an average of −1.06R says losses run about 6% past the exit you'd already decided on. Some of that is gap risk and slippage you can't control; the rest is stops being widened in the moment. Splitting losers into gapped and not-gapped separates the two.
What is a good expectancy per trade?
Any positive number, net of fees, on a sample big enough to believe — that is the entire bar, and most records don't clear it. Chasing a high figure is how people end up with a strategy that expects +0.9R and takes three trades a year. Expectancy multiplied by trade frequency is what actually builds an account, so a +0.20R setup you can run 200 times beats a +1.50R setup you run twice.