Options Trading Journal: What to Track That a Stock Journal Misses
A stock trade has one price and one date that matter. An options trade has a strike, an expiry, a volatility level, a multiplier, a margin requirement, and at least four different ways of ending — and a spreadsheet built for the first will report the second incorrectly rather than refusing to.
That’s the awkward part. It doesn’t error. It gives you a number.
Here’s what’s missing, in the order it costs you money.
The Multiplier, Which Breaks Everything Silently
A standard US equity option contract controls 100 shares. Premium quoted at $2.40 is $240 of real money per contract, not $2.40.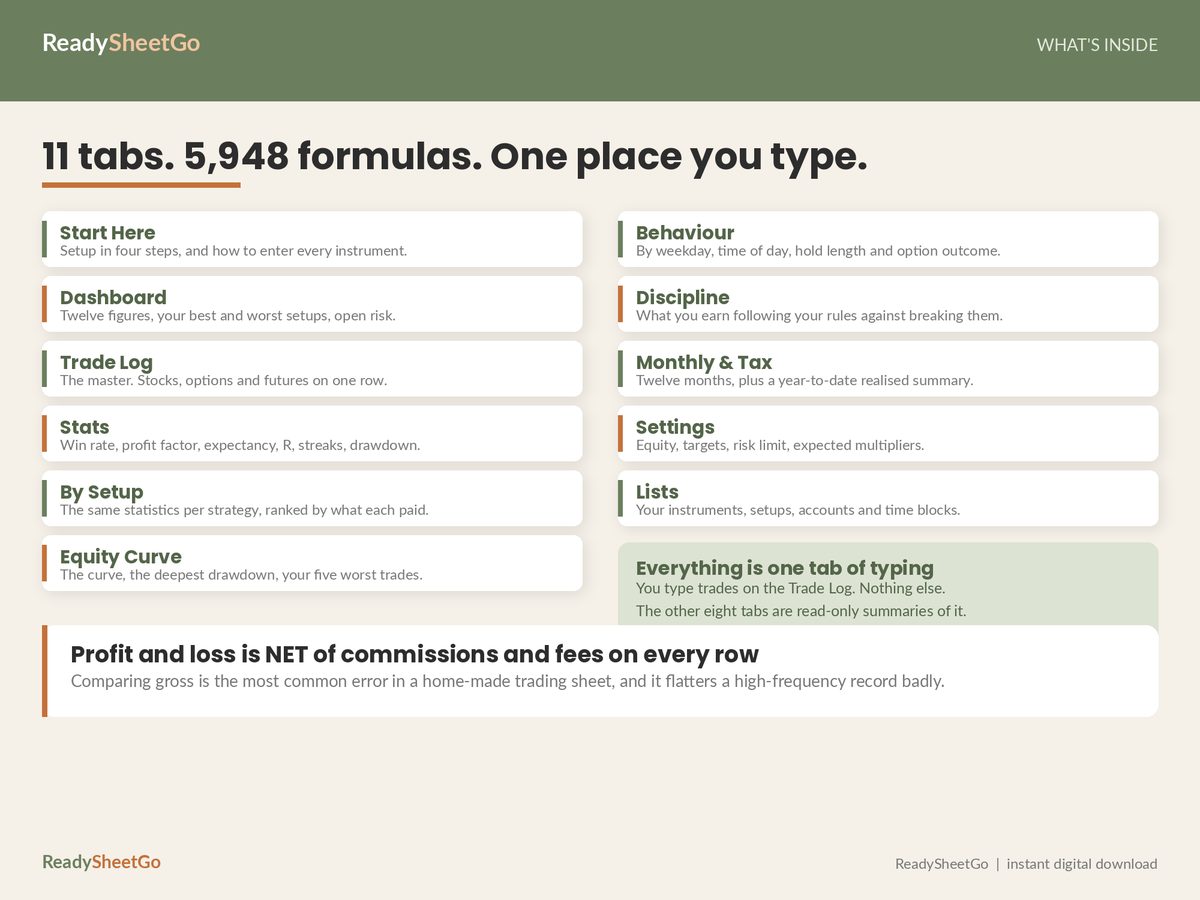
A journal built for stocks computes result as (exit − entry) × quantity. Feed it an options row and you get:
| Stock logic | Correct | |
|---|---|---|
| Sold 3 contracts at $2.40, bought back at $0.85 | (2.40 − 0.85) × 3 = $4.65 | × 100 = $465.00 |
Every options row in the file, wrong by 100×. And because it’s wrong in a consistent direction, it doesn’t look like a bug — it looks like options being a small part of the account. Your win rate stays right, your expectancy collapses, and the per-setup ranking quietly moves every options strategy to the bottom.
Futures make it worse, because there’s no single multiplier to hardcode: each contract has its own, and they differ by an order of magnitude across the products a retail account might touch.
The fix is a multiplier column driven by the instrument type, plus a validation rule that flags a row where the two disagree — an options trade logged at ×1, or a stock trade logged at ×100. It’s a typo that’s invisible among 200 rows and corrupts every average it touches, which is exactly the class of error a self-checking sheet should catch as you type. The main guide covers the row-validation pattern in more detail.
Strike, Expiry, and Days to Expiry at Entry
Three fields, one of which has to be computed at the moment of entry or it’s gone.
Strike and expiry are just identity — without them you can’t reconcile against a statement.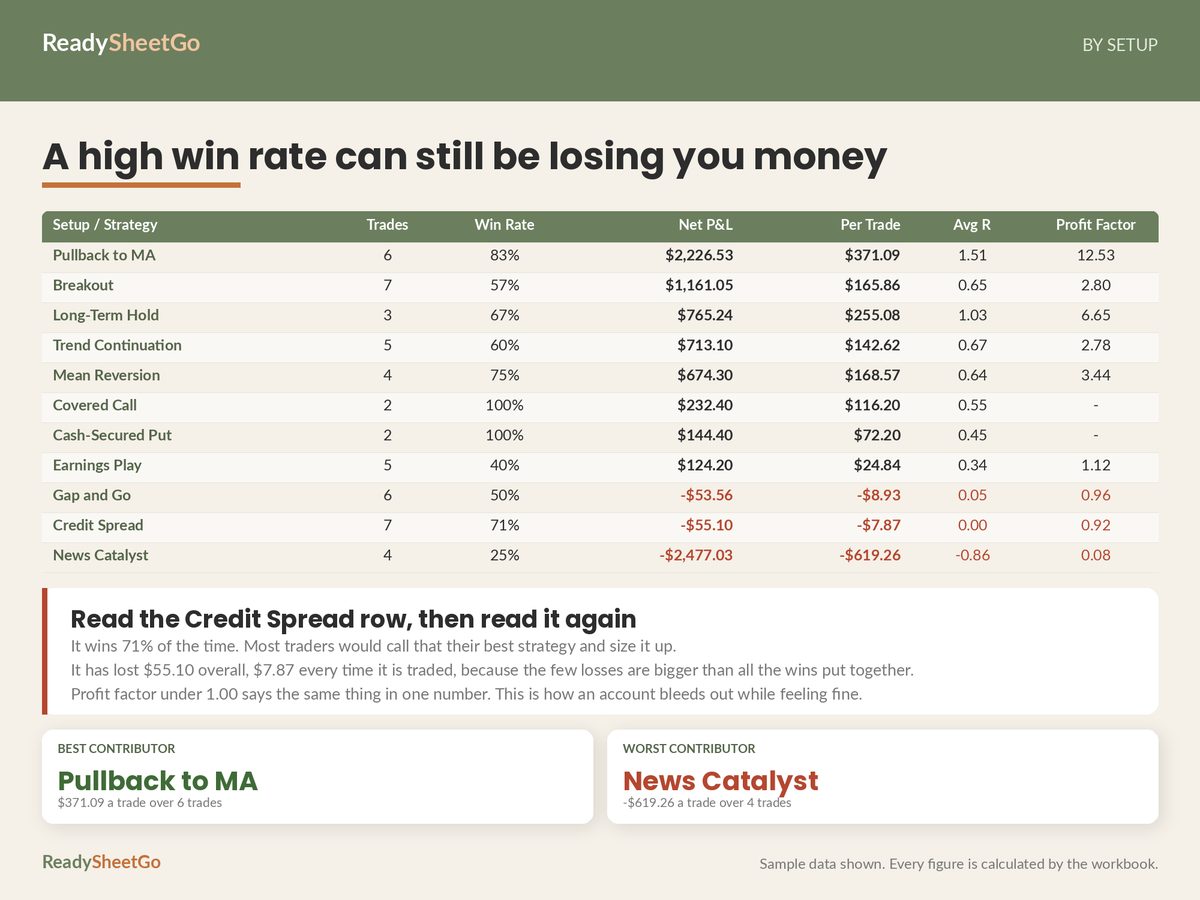
Days to expiry at entry is the one that does analytical work. Entered at 45 DTE or entered at 7 DTE are different trades with different risk profiles even at the same strike, and you cannot recover it later from a closed position unless you stored the entry date and the expiry separately and compute the difference. Store both, derive the DTE, and you can eventually ask whether your short premium does better entered further out — which is one of the genuinely useful questions in this style of trading and unanswerable without the column.
Implied Volatility at Entry
The field people skip, and the one that separates a journal from a log.
IV at entry is the only record of what you were paid for the risk. Sell a put at 38% IV and sell the same strike at 19% IV and you’ve done two different trades with the same ticker, the same expiry and the same strike. Six months later the trade log shows two identical-looking rows and one made money.
It’s a manual entry — you type what the chain showed when you opened. Nobody’s export contains it. Skip it and the question “does my premium selling work better in high IV?” is permanently unanswerable for every trade you’ve already taken.
Net Credit or Debit, and One Row Per Structure
Log the structure, not the legs.
A vertical spread is one row: entry price is the net credit received (or debit paid) per spread, exit price is what you paid to close it, and quantity is the number of spreads. An iron condor is one row, not four. Splitting a condor into four legs gives you four rows that each look like a naked option, quadruples your trade count, wrecks your win rate, and makes the risk on each row look unlimited when the structure’s actual worst case is known and modest.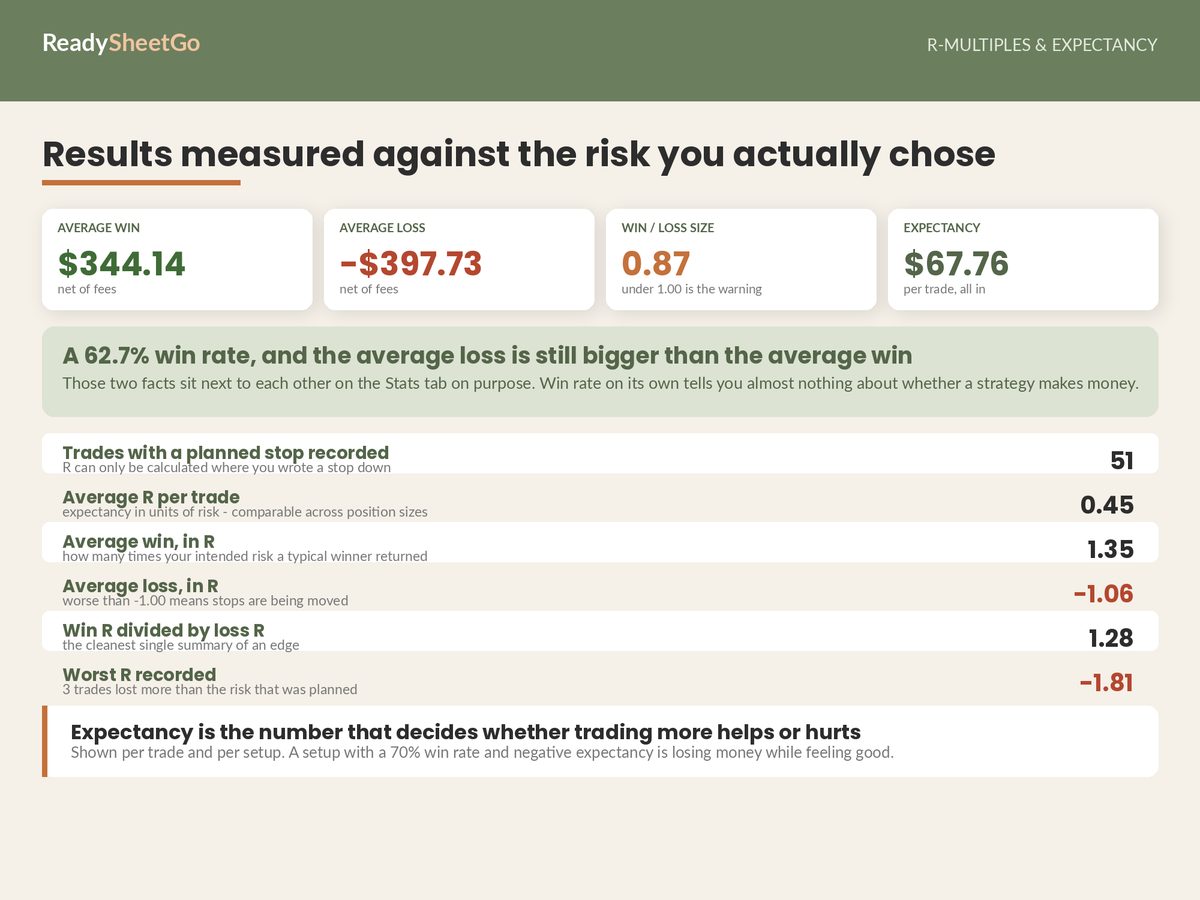
The convention to pick and then never vary: credits positive, debits negative, per unit of structure.
Worked, on a defined-risk credit spread:
- Sell the $47 put, buy the $45 put, net credit $0.62 per spread, 5 spreads
- Max loss = (strike width $2.00 − credit $0.62) × 100 × 5 = $690.00
- Max gain = $0.62 × 100 × 5 = $310.00
- Closed for $0.18: result = (0.62 − 0.18) × 100 × 5 = +$220.00, before fees
That $690 max loss is your initial risk for R-multiple purposes. This is the neat thing about defined-risk structures: the worst case is arithmetic, so the row gets a valid R even though you never set a stop. The trade above is +$220 on $690 risked, or +0.32R.
How It Ended
Four outcomes, one dropdown: expired worthless, closed early, assigned, exercised.
This is the field that answers a question almost every options trader has an opinion about and almost none have measured — should I be holding these to expiry, or taking profit early? Group your results by outcome and compare what each earned per trade. The answer is yours specifically, it’s frequently not what you assumed, and it requires nothing more than remembering to set a dropdown when you close.
Assignment needs its own value because it’s an event, not a result: it changes what you hold, it can arrive early on American-style contracts, and it has tax consequences that a journal deliberately does not try to compute.
Margin or Buying Power Used
A stock trade’s capital commitment is obvious — price times quantity. A short option’s isn’t, and a spread’s is different again.
Without this column you can rank setups by return per trade but never by return on the capital they tied up, which is the comparison that actually decides what to run when both can’t be on at once. A credit spread earning $40 per trade on $690 of buying power and a covered call earning $116 per trade on $4,800 look very different once the denominator appears.
Where the Win Rate Trap Lives
Everything above matters more for options than stocks because of one structural fact: defined-risk premium strategies are built to win often and lose big. Win rate is close to meaningless as a measure of them.
From the Options, Stock & Futures Trading Journal worked sample account, illustrative figures:
| Setup | Trades | Win rate | Net | Per trade | Profit factor |
|---|---|---|---|---|---|
| Credit Spread | 7 | 71.4% | −$55.10 | −$7.87 | 0.92 |
| Covered Call | 2 | 100% | +$232.40 | +$116.20 | — |
| Cash-Secured Put | 2 | 100% | +$144.40 | +$72.20 | — |
Seven credit spreads. Five winners, two losers. A 71.4% win rate — and it is the second-best win rate in the entire account, better than the strategy that made the most money. It has lost $7.87 every time it’s been traded, because the two losses came to about $724 against roughly $669 of wins.
Sort your setups by win rate and this is the one you’d do more of. Sort by expectancy per trade and it’s the one you’d fix.
The covered call and cash-secured put rows carry the opposite warning. Two trades each, 100% win rate, no profit factor at all because there are no losses yet to divide by. Those aren’t findings — they’re two trades. Any journal that prints “100%” next to them without flagging the sample size is inviting you to size up on nothing, which is why a minimum-sample setting that marks thin statistics provisional belongs in the file rather than in your head.
The Row Format That Holds Both
Keep stock and options trades on one tab, one row format. Stock fields first, options fields after, blank where they don’t apply.
Split them and every account-level statistic — win rate, expectancy, drawdown, equity curve, monthly P&L — is computed on a partial record. You end up with two half-answers and no view of the account you actually run.
Featured on ReadySheetGo
Options, Stock & Futures Trading Journal — built for exactly this row format. Strike, expiry, days to expiry, implied volatility at entry, assignment, contract multiplier and margin used sit on the same row as the stock fields, with the entry convention for each structure written out: long options, short options, vertical spreads, iron condors, futures and short stock are all handled, one row per structure. Contract multipliers are set per instrument in Settings and the Row Check column flags a row where the multiplier doesn’t match the instrument — the ×100 error, caught as you type. The Behaviour tab includes a by-outcome table comparing expired worthless against closed early on what each earned per trade, and the By Setup tab ranks every strategy by per-trade expectancy and profit factor rather than win rate. Set your minimum sample size and anything thinner is marked provisional. 11 tabs, 5,948 formulas, 51 closed sample trades. Excel and Google Sheets, no macros. Instant digital download — $17.99.
Illustrative figures only, from sample data. Not financial, investment or tax advice. Options involve risk and are not suitable for all investors; assignment and exercise carry tax consequences a journal does not compute — your broker’s year-end statement is the authoritative document.
Frequently Asked Questions
What extra fields does an options trading journal need?
Nine beyond the stock set: strike, expiry, days to expiry at entry, option type, implied volatility at entry, contract multiplier, net credit or debit, margin or buying power used, and how the position ended — expired worthless, closed early, assigned or exercised. Without the multiplier every dollar figure is wrong by a factor of 100; without the outcome field you can't tell whether holding to expiry has paid you.
How do I log a credit spread in a spreadsheet?
One row for the structure, not one row per leg. Entry price is the net credit received per spread, exit price is what you paid to close (zero if it expired worthless), and quantity is the number of spreads. Max loss is the width of the strikes minus the credit, times 100, times quantity — and that figure is your initial risk for the R-multiple, because a defined-risk spread has a known worst case whether or not you set a stop.
Why does my options P&L look wrong in my spreadsheet?
Almost always the contract multiplier. A standard US equity option controls 100 shares, so a premium quoted at $2.40 is $240 of actual money per contract. A journal built for stocks multiplies price by quantity and stops there, which makes every options row off by 100×. The fix is a multiplier column driven by the instrument type and a validation rule that flags an options row logged at ×1.
Should options and stock trades live in the same journal?
Yes, on the same tab, if the tab is built for it. Splitting them means your win rate, expectancy and drawdown are computed on two partial records and never on the account you actually run. One row format with the options fields sitting alongside the stock fields, left blank for stock trades, keeps every statistic whole.