Trading Journal Spreadsheet: What to Track on Every Trade
Most trading journals fail in the same quiet way. They record what happened and can’t tell you what to change.
The entries are accurate. Date, ticker, in, out, profit or loss. At the end of the quarter there’s a number at the bottom of the column, and the number is either bigger or smaller than it was. What’s missing is any way to ask which of the things I do actually works — because the sheet was built to store trades rather than to compare them.
The difference is about eight extra columns. This is what they are, why each one earns its place, and what the finished thing tells you that the broker statement can’t.
The Fields That Do the Work
A journal row splits into four groups. Only the first is what most people log.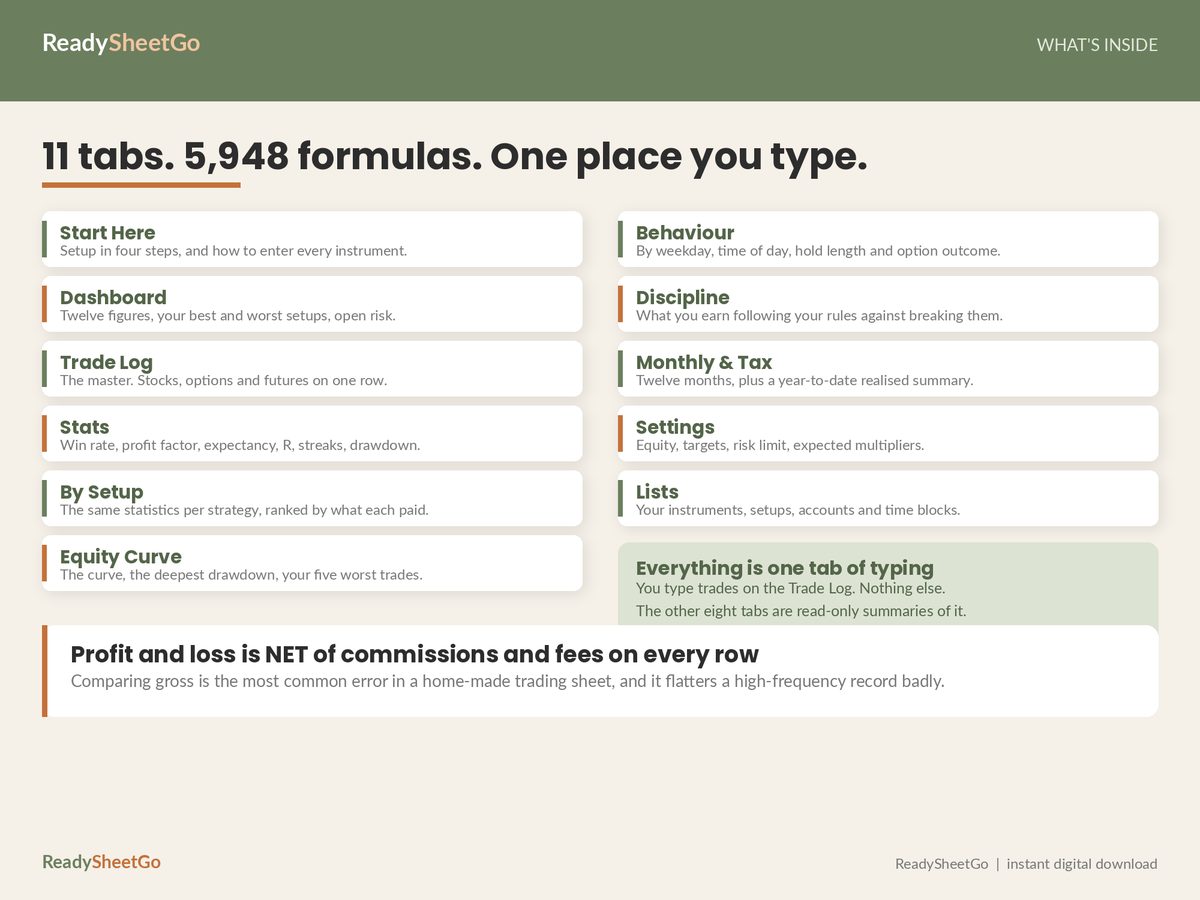
What happened — the mechanical record. Entry date, exit date, instrument, direction, quantity, entry price, exit price, commissions and fees. Eight fields, all of them available on your confirmations, none of them requiring a judgement call.
What you intended — the fields that turn a log into a review. Your planned stop, the setup or strategy name, and your intended position size. These have to be written down before or at entry, because afterwards you will remember a more flattering version. The planned stop is the single highest-value column in the whole sheet and the one most often missing.
What it cost you to be wrong — derived, not typed. Risk in dollars is entry minus planned stop, times quantity, times the contract multiplier. R-multiple is the trade’s net result divided by that risk. These two columns are what let a $200 win on a tight stop be compared honestly with a $200 win on a loose one.
What you did about it — two yes/no questions per row. Did you take the stop you planned? Did you size it the way you meant to? They feel trivial to log. They produce the most uncomfortable and most useful table in the file.
Everything else — win rate, profit factor, expectancy, drawdown, streaks, results by weekday — is arithmetic on top of those. You don’t type any of it.
A Worked Review: 51 Closed Trades
Here’s the headline block from a full worked account. These figures come from the sample data that ships inside the Options, Stock & Futures Trading Journal, and they’re illustrative — they describe one hypothetical record, not a result you should expect.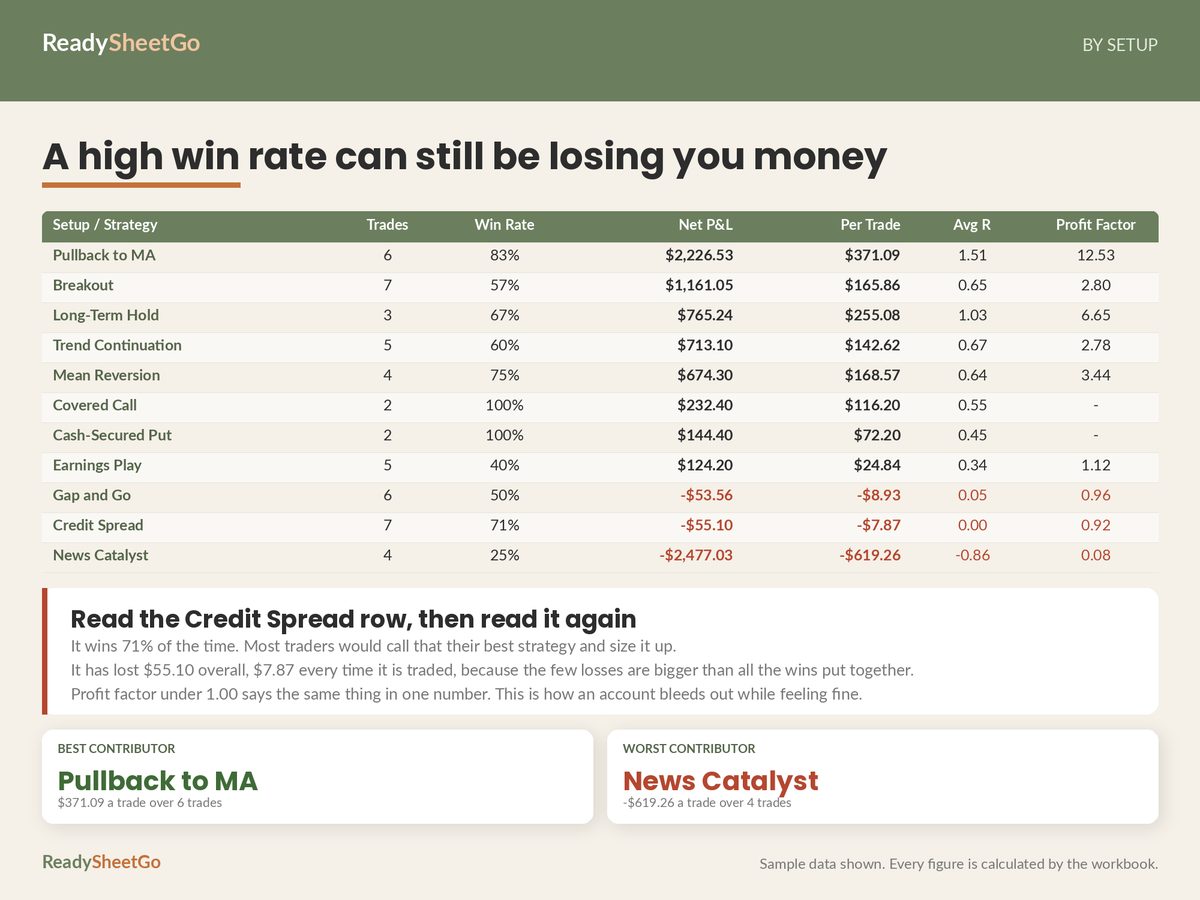
| Figure | Value |
|---|---|
| Closed trades | 51 |
| Open positions | 4 |
| Net P&L after fees | $3,455.53 |
| Win rate | 62.7% |
| Profit factor | 1.46 |
| Expectancy per trade | $67.76 |
| Average R | +0.45 |
| Deepest drawdown | −7.81% |
| Longest losing run | 2 |
| Fees as a share of gross profit | 1.18% |
| Plan adherence | 86.3% |
Read across the top row and this looks like a competent account. Wins 63% of the time, makes $1.46 for every $1.00 it loses, nets three and a half thousand dollars, never draws down more than 8%.
Now the part the top row hides.
Thirty-two wins averaged $344.14. Nineteen losses averaged −$397.73. The average loss is bigger than the average win — a win/loss ratio of 0.87. This account only works because it wins often enough to carry losers that are individually worse. That is a real, legitimate way to trade, and it is also fragile in a specific way: the win rate is doing all the load-bearing. A stretch where it slips from 63% to 52% flips the whole thing negative, and nothing on the dashboard warns you, because the dashboard reports what happened rather than what it depends on.
You can only see that because two columns exist: average win and average loss, separated rather than netted.
The Setup That Wins 71% and Loses Money
Break the same 51 trades down by strategy and the account stops being one thing.
| Setup | Trades | Win rate | Net P&L | Per trade | Profit factor |
|---|---|---|---|---|---|
| Pullback to MA | 6 | 83.3% | +$2,226.53 | +$371.09 | 12.53 |
| Breakout | 7 | 57.1% | +$1,161.05 | +$165.86 | 2.80 |
| Long-Term Hold | 3 | 66.7% | +$765.24 | +$255.08 | 6.65 |
| Trend Continuation | 5 | 60.0% | +$713.10 | +$142.62 | 2.78 |
| Mean Reversion | 4 | 75.0% | +$674.30 | +$168.58 | 3.44 |
| Earnings Play | 5 | 40.0% | +$124.20 | +$24.84 | 1.12 |
| Credit Spread | 7 | 71.4% | −$55.10 | −$7.87 | 0.92 |
| Gap and Go | 6 | 50.0% | −$53.56 | −$8.93 | 0.96 |
| News Catalyst | 4 | 25.0% | −$2,477.03 | −$619.26 | 0.08 |
The Credit Spread line is the one worth sitting with.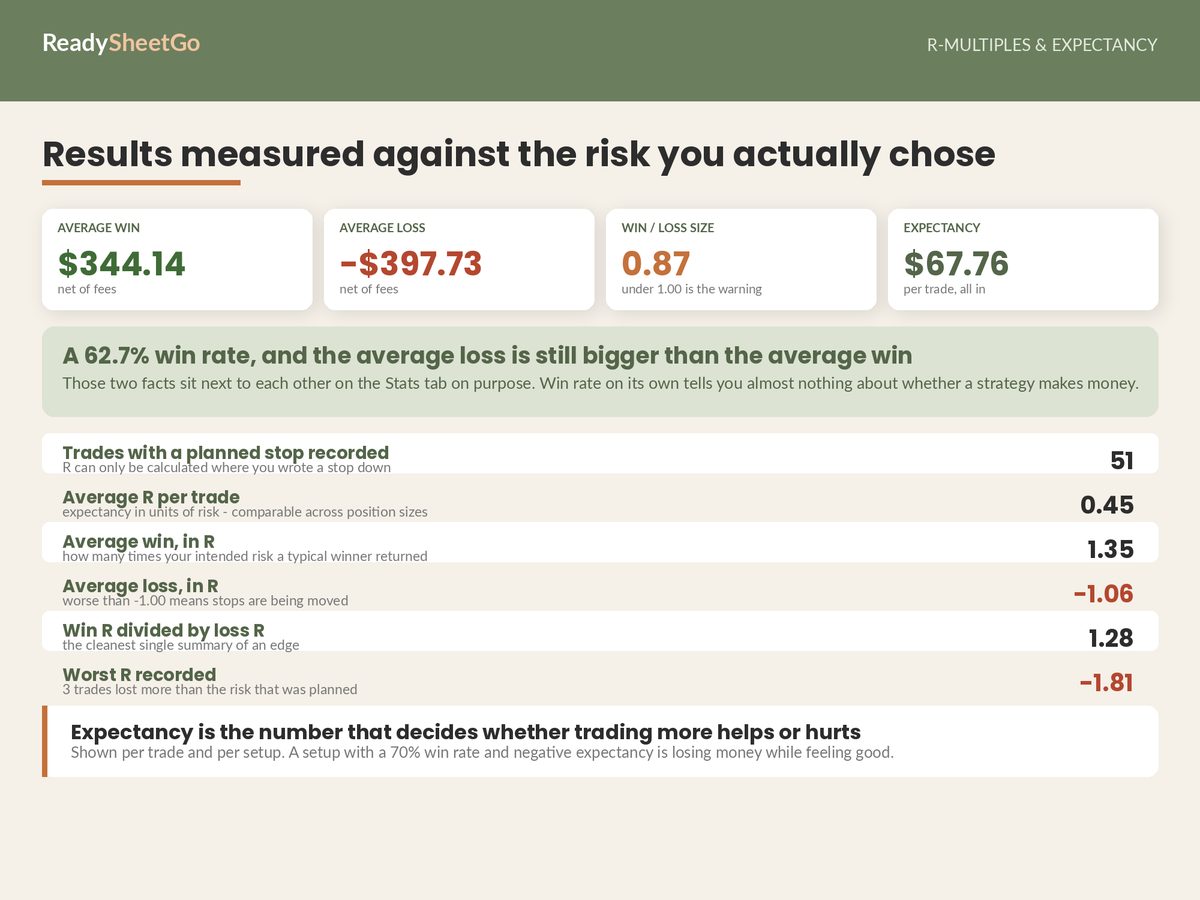
Seven trades. Five winners, two losers. A 71.4% win rate — the second-best in the account, better than the setup that made the most money. Sorted by win rate, it looks like the thing you should do more of.
It loses money. The five wins total roughly $669; the two losses total roughly $724. Every trade of it has cost $7.87 after fees. A plain trade log — one that records P&L per trade and nothing else — would show you a column of mostly-green rows and a small negative total you’d attribute to noise.
This is the structural thing about defined-risk credit strategies generally: they’re built to win often and lose big, so win rate is close to meaningless as a measure of them and per-trade expectancy is the only figure that means anything. A journal that ranks setups by win rate will recommend exactly the wrong one.
The News Catalyst line is a different failure. Four trades, 25% win rate, −$619.26 per trade — it lost more on its own than the rest of the account made. But four trades is four trades. One of them was the worst loss in the record at −$2,083.53, and with a sample that small the honest read is “this is unmeasured and it has already hurt,” not “this setup doesn’t work.” Which is why a minimum sample size matters: set one, and every statistic built on fewer closed trades than that gets flagged provisional rather than presented as fact. Presenting a four-trade win rate as a finding is where most journals overclaim.
Why R-Multiples Change the Ranking
Dollars aren’t comparable across trades of different size. R-multiples are.
R is the trade’s net result divided by the money you deliberately put at risk — entry to planned stop, times quantity, times multiplier. A trade that made twice what you risked is +2R whatever the dollar figure. In the worked account:
- Average R across all closed trades: +0.45
- Average R on winners: +1.35
- Average R on losers: −1.06
That last number is the one to look at. A loser should come in at −1.00R, because −1.00R is the stop. An average of −1.06 means losses are running about 6% past where they were supposed to stop. Six percent sounds like slippage. Across nineteen losses it’s about $428 — roughly 12% of everything the account made that year, spent on trades you had already decided to be out of.
No dollar figure anywhere on the dashboard shows you that. It only appears once every result is expressed against its own planned risk. The full arithmetic, including why expectancy in R is more portable than expectancy in dollars, is in how to calculate R-multiple and expectancy in a trading journal.
The Two Columns You’ll Want to Skip
Did you take the stop you planned? Did you size it the way you meant to?
Two dropdowns per row. They add maybe four seconds to logging a trade, and they’re the first thing people quietly stop filling in, because on a losing trade the honest answer is annoying to type.
In the worked account, plan adherence runs at 86.3% — roughly seven rule-breaks in 51 trades. Split the results by that column and the gap between trades where the rules were followed and trades where they weren’t comes out at $660.69 per trade.
Seven trades. Six hundred and sixty dollars each. That’s not a strategy problem and no amount of setup analysis will find it, because the setups were fine — the execution wasn’t. It’s the single largest recoverable number in the file and it’s invisible unless someone writes down “no” on a bad day.
Net of Fees, On Every Row
The most common error in a home-made trading sheet is comparing gross results.
It’s understandable — the gross number is the one you can compute from entry and exit alone, and fees feel like rounding. In the worked account total fees are $130.39, or 1.18% of gross profit. Genuinely small. But that account holds positions for an average of 29.8 days.
Run the same fee load through a record turning over positions daily rather than monthly and the ratio changes by an order of magnitude. Fees as a share of gross profit is a diagnostic almost nobody calculates about their own trading, and it’s the number that tells a high-frequency approach whether it’s actually a strategy or a way of paying a broker. Put fees in the sheet per row, and every downstream figure — expectancy, profit factor, per-setup ranking — is net without you thinking about it again.
Behaviour Columns: Cheap to Log, Slow to Pay
Weekday. Time of day. Holding period band. For options, how the position ended — expired worthless, closed early, assigned.
None of these tell you anything in month one. By month six they start producing statements like “every Friday afternoon trade in this record is a loser” or “positions closed early earned more per trade than positions held to expiry.” They’re pattern-finders, and their entire value comes from consistency of logging, which is why they belong as dropdowns rather than free text.
One warning: with enough behavioural columns and a small sample, you will always find something. Twelve months of a few trades a week is a few hundred rows, and a few hundred rows will happily produce a spurious “Tuesdays are bad.” Treat these as hypotheses to watch, not conclusions — the same minimum sample size that governs setups should govern them.
Build It So You’ll Actually Use It
Three rules that decide whether a journal survives its second month.
One tab for entry. If logging a trade means touching three sheets, it won’t happen on the day you lose money, which is the day the entry matters most. Everything else should be derived.
Half-finished rows must not pollute the statistics. Leave an exit date blank while a trade is open and that row has to sit out of every average until it closes. Otherwise an open position with no exit price drags the win rate around and you learn to distrust your own dashboard — after which you stop reading it.
The sheet should check itself. A contract multiplier that doesn’t match the instrument, an exit date before the entry date, a quantity of zero, a stop set equal to entry, a position risking more than the limit you set yourself. These are typos, they’re invisible once they’re one row among two hundred, and each one silently corrupts every figure downstream. A validation column that flags them as you type costs nothing and catches all of them.
Then the review. Monthly is about right for most people — weekly is too noisy to act on, quarterly is too late to change anything. Three questions: which setups are above and below zero on a per-trade basis, is average loss R drifting worse than −1.00, and what did the rule-breaks cost this month.
That’s the whole loop. Log honestly, compare per trade rather than in total, and act on the two or three lines that are clearly negative.
Featured on ReadySheetGo
Options, Stock & Futures Trading Journal — the workbook the worked example above comes from. 11 tabs, 5,948 formulas. A 200-row Trade Log that puts stocks, long and short options, vertical spreads, iron condors, futures and short stock on the same row; a Stats tab returning win rate, profit factor, expectancy, R-multiples, streaks and drawdown with every figure net of fees; a By Setup tab repeating those statistics per strategy and ranking them by what each actually contributed; an Equity Curve with your deepest drawdown and five worst trades; a Behaviour tab by weekday, time of day, holding period and option outcome; a Discipline tab comparing rule-followed against rule-broken results; a Monthly & Tax tab with a year-to-date realised summary; and a Row Check column that catches mismatched multipliers, reversed dates, zero quantities and positions over your own risk limit. Set your minimum sample size and anything thinner is flagged provisional. 51 closed and 4 open sample trades included. No macros, no array formulas. Excel and Google Sheets. Instant digital download — $17.99.
Read Next
- How to Calculate R-Multiple and Expectancy in a Trading Journal — the arithmetic, worked line by line
- Trading Journal vs Broker Statement: What Your P&L Hides — why an accurate statement still can’t tell you what to fix
- Options Trading Journal: What to Track That a Stock Journal Misses — strike, expiry, IV at entry, assignment and multiplier
- Prop Firm Challenge Tracker: Logging Drawdown and Daily Loss — running an evaluation against two drawdown limits at once
Illustrative figures only, from sample data. This is a record-keeping and review method, not financial, investment or tax advice. Trading involves risk of loss and past results do not predict future results.
Frequently Asked Questions
What should a trading journal spreadsheet include?
At minimum: date in and out, instrument, direction, quantity, entry price, exit price, commissions and fees, your planned stop, your setup name, and whether you followed your own rules. Everything worth knowing is derived from those. The two fields most home-made journals omit are the planned stop — without it you can't compute R-multiples — and fees, without which every figure is gross and flatters an active record.
How many trades do I need before my win rate means anything?
More than most people assume. A setup with four trades in it tells you almost nothing: one outcome moves the win rate by 25 percentage points. Setting a minimum sample size — 20 to 30 closed trades per setup is a common working floor — and marking anything below it as provisional stops you retiring a strategy on noise. The honest answer is that small samples should change your curiosity, not your position sizing.
Is win rate or profit factor more important?
Neither on its own. Win rate tells you how often you're right; profit factor tells you how much the right calls earned against what the wrong ones cost. A setup can win 71% of the time and still lose money if two losses outweigh five wins — that is exactly what happens in the worked example on this page. Expectancy per trade combines both into the only figure that answers 'is this worth doing again'.
Should I use a trading journal spreadsheet or a journaling app?
An app auto-imports fills, which removes typing and removes the review that typing forces. A spreadsheet makes you re-handle every trade, holds fields no app models — your setup names, your time blocks, whether you honoured your stop — and keeps the data in a file you own with no subscription. If you trade hundreds of times a month, import speed wins. If you trade a few times a week and want the review, the spreadsheet wins.