Portfolio Tracker Spreadsheet vs App: Which Is Better?
The honest answer is that they’re good at different things, and the marketing on both sides is unhelpful. Apps oversell automation as though tracking were the hard part of investing. Spreadsheet people oversell control as though everyone enjoys typing.
Here’s the actual comparison, including the parts that don’t favour the spreadsheet.
What the App Genuinely Does Better
Prices update themselves. This is the real feature and it shouldn’t be dismissed. Connect your accounts and the value is current every time you open it, with no action from you.
It catches transactions you forgot. A dividend reinvestment, a fractional share purchase, a fee — the app sees them because it’s reading the account. A spreadsheet only knows what you told it, and the gap between those two is where manual tracking goes wrong.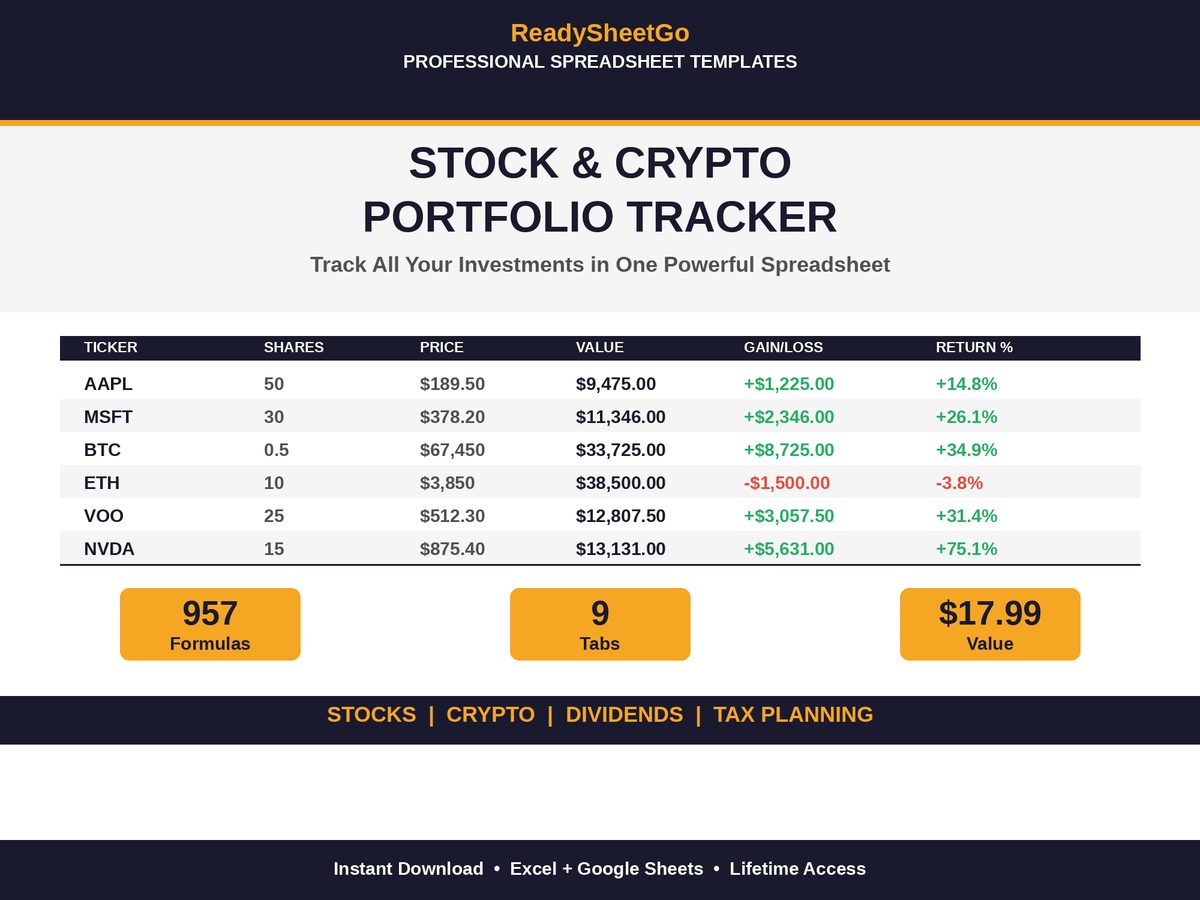
Multiple accounts, no reconciliation. If you hold five accounts across three brokers, a syncing app removes a genuinely tedious job.
Zero setup discipline required. No monthly routine to maintain. For a lot of people that’s decisive, and pretending otherwise doesn’t help anyone.
What the Spreadsheet Genuinely Does Better
It can hold what the app can’t see. Coins in a hardware wallet. A private investment. An old employer plan the aggregator doesn’t support. A relative’s account you help manage. Every one of those is invisible to a connection-based tool, and a portfolio picture with holes in it is worse than useless for allocation decisions — it systematically understates whatever is hardest to connect.
Your asset classes, your targets. Apps categorise your holdings for you, and their categories are frequently wrong at the edges — a REIT filed as real estate rather than equity, a total-world fund split in a way you disagree with, crypto as a single blob. In a spreadsheet you define the six or eight buckets you actually think in, set targets against them, and the drift calculation means what you intended it to mean.
Tax lots structured your way. Which lot you sell changes what you report, and a per-lot log you control is the document your preparer wants. Apps vary enormously in how they handle lots, and you find out how yours handles them at the worst possible moment.
Yield on cost. Almost no app shows it, because it requires remembering what you paid rather than what things are worth. It’s the number dividend investors actually care about.
No credentials handed over. A read-only brokerage connection is a modest risk, not a large one — but it’s a risk that a file on your own drive doesn’t have at all.
It doesn’t get discontinued. Portfolio trackers get acquired, sunset, or repriced with some regularity, and the export you get on the way out is rarely the one you wanted. A .xlsx file opens in ten years.
The Cost Comparison
This is the part worth doing with real numbers, because subscription pricing hides in the monthly framing.
| Subscription app | Spreadsheet | |
|---|---|---|
| Year 1 | $120 | $17.99 |
| Year 3 cumulative | $360 | $17.99 |
| Year 5 cumulative | $600 | $17.99 |
| Year 10 cumulative | $1,200 | $17.99 |
Assumes an app at $10/month — a common mid-tier price, though free tiers and pricier ones both exist, so use the actual price of the one you’re considering. The spreadsheet figure is a one-time purchase; a self-built one is free plus an afternoon.
$600 over five years is not ruinous. But it’s worth noticing what it buys: on a $51,000 portfolio, five years of a $10 subscription is 1.2% of the portfolio spent on watching it. Whether that’s good value depends entirely on the next section.
The Real Question: How Much Work Is Manual, Actually?
The case for the app rests on manual updating being a burden. So price it.
A ten-position portfolio — six stock lines and four crypto lines, like the worked portfolio in the main guide — takes about this long once a month:
- Paste ten current prices: 2 minutes
- Log dividends received: 2 minutes
- Record the month’s total and any deposits: 1 minute
- Look at the allocation drift column: 2 minutes
- Log any trades made since last time: 2 minutes
Call it ten minutes a month, two hours a year. At $120/year, the app is charging roughly $60 an hour for those two hours.
Two things move that number badly. If you hold forty positions across six accounts, the monthly pass is genuinely long and the app starts winning on time alone. And if you’re the sort of person who will open the sheet daily, ten minutes a month becomes five hours a year and you will quit — which is the actual failure mode of manual tracking, and it’s a discipline problem rather than a tooling one.
The Middle Path: Let the Sheet Fetch Prices
The gap between the two options is narrower than it used to be, because spreadsheets can fetch prices themselves.
In Google Sheets:
=GOOGLEFINANCE("MSFT","price")          → delayed stock quote
=GOOGLEFINANCE("CURRENCY:BTCUSD")       → major crypto pairs
In Microsoft 365 Excel: select a cell containing a ticker, convert it with the Stocks data type on the Data ribbon, then reference =A2.Price — refreshing on demand.
Coverage is imperfect. Some funds, some non-US tickers and some smaller coins simply aren’t supported, and a formula that returns an error for two of your ten holdings is more annoying than typing ten numbers. The pragmatic setup is a plain price column you can type into, with a linked formula in the rows where the lookup works reliably — which is also why well-built templates ship with plain number cells rather than hard-wiring a function that breaks for half the people who open the file.
Do that and you’ve kept the app’s main advantage while keeping everything in the “spreadsheet does better” column.
The Short Version
Use the app if you hold many accounts, trade frequently, want a hands-off record, or know from experience that you won’t maintain a monthly habit.
Use the spreadsheet if you hold assets an app can’t connect to, want allocation targets and tax lots defined your way, care about yield on cost, would rather not pay a subscription to look at your own money, or want a record that outlives whichever company built the app.
Use both, which is what a lot of people end up doing: the app for the day-to-day glance, the spreadsheet as the monthly record that includes the cold wallet and produces the tax document.
Featured on ReadySheetGo
Stock & Crypto Portfolio Tracker — a one-time $17.99 rather than a subscription. 9 tabs and 957 working formulas: a 50-row Stock Trade Log with automatic cost basis, holding period and short-term/long-term classification; a Dividend Tracker returning dividend per share, annual projected income and yield on cost; Crypto Positions for up to 30 holdings across any exchange or wallet, including ones no app can see; a Watchlist with target buy prices and green/amber/red buy-zone alerts; Asset Allocation across six asset classes with your own targets, drift flags and dollar rebalancing amounts; a 36-month performance log; a Tax Summary splitting realized gains short-term from long-term for Schedule D prep; and a Portfolio Dashboard. Plain price cells you can type into or link. Excel and Google Sheets, no macros. Instant digital download — $17.99.
Not investment or tax advice. Figures are illustrative; app pricing varies, so check the current price of any service you’re comparing.
Frequently Asked Questions
Is a portfolio tracking app worth paying for?
It's worth it if you hold many accounts, trade often, or genuinely won't update anything manually — automatic syncing is a real feature and a spreadsheet can't replicate it. It's poor value if you hold a dozen positions you rarely change, because you're renting price-fetching for a job that takes ten minutes a month. Price the subscription over five years before deciding: at $10 a month that's $600.
Can a spreadsheet pull live stock prices?
Google Sheets can, with =GOOGLEFINANCE("MSFT","price") for delayed stock quotes and =GOOGLEFINANCE("CURRENCY:BTCUSD") for major crypto pairs. Microsoft 365 versions of Excel offer the Stocks data type, which converts a ticker cell into a linked entity you can reference with .Price. Coverage isn't universal — some tickers, funds and regions aren't supported — so treat it as a convenience rather than the foundation of the file.
How long does it actually take to update a portfolio spreadsheet manually?
For a ten-position portfolio, roughly ten minutes a month: paste current prices, log any dividends received, record the month's total, glance at allocation drift. Transactions get logged the day they happen, which takes under a minute each. The people who find it unbearable are usually updating daily, which produces no better decisions and about thirty times the work.
What can a spreadsheet track that an app can't?
Anything the app can't connect to — coins in cold storage, a private investment, an old employer plan, physical assets. It also lets you define your own asset classes and targets rather than accepting the app's categories, keep a tax lot log structured the way your preparer wants it, and hold data that isn't sitting behind someone else's login and read-only brokerage connection.