Short-Term vs Long-Term Capital Gains: What Selling Early Costs
There’s a moment, usually somewhere between month nine and month twelve of holding something that’s gone up, where a spreadsheet earns its entire purchase price by displaying one word: Short-Term.
Not because the word is complicated. Because without it in front of you, the holding-period question never gets asked at all — and the answer is sometimes a few dollars and sometimes several hundred.
The Two Clocks
Every position you own is running a clock that starts the day after you buy and ends the day you sell. Cross one year and the gain changes character:
- Short-term (held one year or less) — taxed as ordinary income, at whatever your marginal bracket is.
- Long-term (held more than one year) — taxed at the 0%, 15% or 20% long-term rates, depending on taxable income. Those bracket thresholds are adjusted each year, so check the current figures rather than a number you remember.
Add the 3.8% net investment income tax, which applies to investment income above modified AGI of $200,000 single or $250,000 married filing jointly — thresholds that are set in statute and are not inflation-adjusted, so they catch more people every year — and the spread between the two treatments only widens.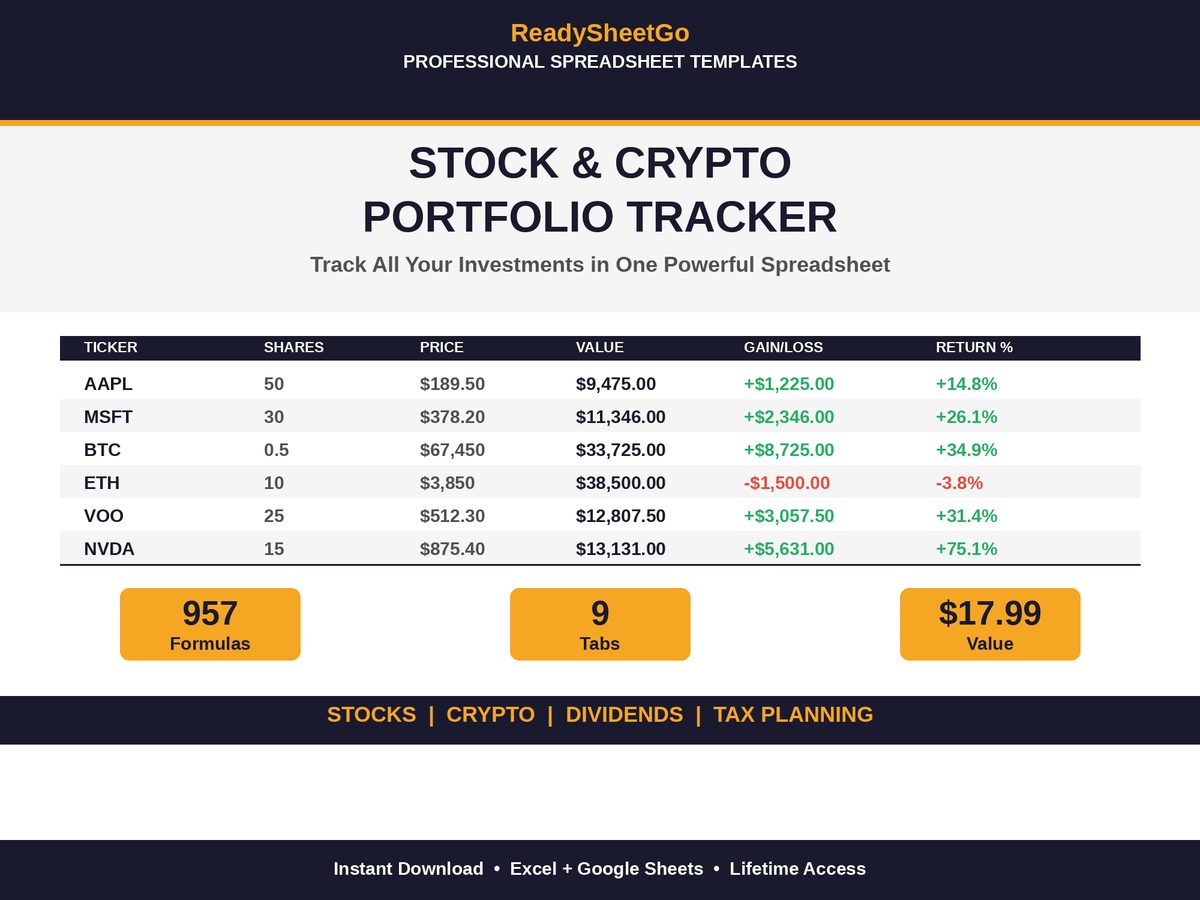
The off-by-one detail worth knowing: buy on 14 October 2025 and you need to sell on 15 October 2026 or later. Selling on the 14th is short-term by a single day. A spreadsheet column of =TODAY()-purchase_date with =IF(days>=365,"Long-Term","Short-Term") beside it removes the entire class of mistake.
Case A: When It Doesn’t Matter
From the worked portfolio in the main guide: 60 shares of VXUS bought 4 November 2025 at $63.80, now $68.40. Held 290 days as of 21 August 2026 — short-term, with 76 days to run.
- Cost basis: $3,828.00
- Value now: $4,104.00
- Gain: $276.00
Assume this investor’s marginal ordinary rate is 22% and their long-term rate is 15% — an assumption, not a lookup; use your own.
- Sell today (short-term): $276.00 × 22% = $60.72
- Sell after 5 November (long-term): $276.00 × 15% = $41.40
- Saving from waiting: $19.32
Nineteen dollars, on a position that routinely moves more than that in a week. If you want to sell this position, sell it. The holding period is not the deciding factor here, and pretending otherwise is how people end up holding things they’ve already decided they don’t want.
Case B: When It Very Much Does
Same investor, a concentrated single-stock position: 100 shares bought 14 October 2025 at $84.00, now trading at $146.00. Held 311 days — short-term, with 55 days to run.
- Cost basis: $8,400.00
- Value now: $14,600.00
- Gain: $6,200.00
| Sell today | Wait 55 days | |
|---|---|---|
| Character | Short-term | Long-term |
| Assumed rate | 22% | 15% |
| Federal tax on gain | $1,364.00 | $930.00 |
| After-tax proceeds | $13,236.00 | $13,670.00 |
| Difference | +$434.00 |
$434 for waiting fifty-five days on money you weren’t going to spend anyway. That’s a real number and it’s worth having on the screen before you click sell.
The Break-Even Nobody Calculates
But $434 is only half the trade, and the other half is the part that gets skipped. Waiting means holding a $14,600 position for another 55 days, and it can fall while you wait.
The break-even is one division:
Break-even drop = tax saving / current value
                = $434.00 / $14,600.00
                = 2.97%
The price can fall 2.97% — from $146.00 to $141.66 — before the drop cancels the tax saving entirely. Anything worse and you’ve paid more than $434 to save $434.
Now the question is answerable rather than vague. Is a 3% move in 55 days unusual for this position? For a broad index fund, that’s a slightly bad two months and the wait is probably worth it. For a single high-volatility name that moves 3% on a Tuesday, you are making a volatility bet to save a tax bill, which is a strange thing to do on purpose.
Run it on Case A and the point sharpens: $19.32 / $4,104.00 = 0.47%. A half-percent buffer over 76 days is nothing. The tax tail should not be wagging that dog.
Losses Are the Other Half of the Log
The same log that flags gains flags losses, and losses have their own arithmetic.
Realized losses offset realized gains of the same character first — short-term against short-term, long-term against long-term — and then across the two. If losses exceed gains for the year, up to $3,000 of net capital loss can be deducted against ordinary income ($1,500 if married filing separately), and anything beyond that carries forward indefinitely.
This is why a realized-gains tab beats a shoebox of confirmations. Sitting on $6,200 of short-term gains in November and $2,100 of unrealized losses elsewhere is a situation with options in it; discovering the same facts in April is just paperwork.
Two cautions before anyone gets clever. The wash sale rule disallows a loss if you buy the same or substantially identical security within 30 days before or after the sale — the disallowed loss is added to the basis of the replacement shares rather than vanishing, but it doesn’t help you this year. The rule as written applies to stock and securities; the treatment of digital assets has been the subject of ongoing legislative proposals, so don’t assume either way without checking the current position. And harvesting a loss purely for the deduction while giving up a position you wanted to keep is, again, the tail wagging the dog.
What This Looks Like in Practice
Three columns on the trade log and one tab:
- Days held —
=TODAY()-purchase_date - Character —
=IF(days>=365,"Long-Term","Short-Term") - Long-term date —
=purchase_date+366, so you can see when, not just whether
Then a realized gains tab you only touch when you actually sell: ticker, date bought, date sold, proceeds, cost basis, fees, gain, character. That’s the document your preparer wants and the running total that tells you in November what you’re sitting on.
Featured on ReadySheetGo
Stock & Crypto Portfolio Tracker — the Stock Trade Log calculates days held and flags every position Short-Term or Long-Term automatically as the clock runs, and the Tax Summary tab logs realized gains and losses with the same classification applied from your buy and sell dates, totalling net capital gains, fees paid and dividend income for Schedule D prep. Alongside a Dividend Tracker with yield on cost, Crypto Positions across any exchange or wallet, a Watchlist with buy-zone alerts, Asset Allocation with rebalancing amounts, a 36-month performance log and a Portfolio Dashboard. 9 tabs, 957 formulas, Excel and Google Sheets. Instant digital download — $17.99.
Illustrative figures and assumed tax rates only — not investment or tax advice. Rates, brackets and rules change, and your own situation determines the outcome; confirm with a qualified preparer.
Frequently Asked Questions
How long do I have to hold a stock for long-term capital gains?
More than one year. The holding period starts the day after you acquire the shares and ends on the day you dispose of them, so a position bought on 14 October 2025 becomes long-term when sold on 15 October 2026 or later — selling on the 14th is still short-term by one day. A spreadsheet handles this with =TODAY()-purchase_date and a flag at 365.
How much more tax do I pay on a short-term gain?
Short-term gains are taxed as ordinary income at your marginal rate; long-term gains fall into the 0%, 15% or 20% brackets. For an investor whose marginal rate is 22% and whose long-term rate is 15%, that's a 7-percentage-point difference — $434 on a $6,200 gain. The gap is widest for high earners in the top ordinary bracket and can be zero for someone whose income puts them in the 0% long-term band.
Is it always worth waiting to reach the long-term holding period?
No — it's a trade between a known tax saving and an unknown price risk. On a $14,600 position with a $6,200 gain and 55 days to run, waiting saves $434, which the price only has to fall 2.97% to wipe out. Work out the break-even percentage first: divide the tax saving by the position's current value. If that number is small relative to how much the position moves in a normal month, the tax tail is wagging the dog.
What happens to capital losses in the same year?
Losses offset gains of the same character first — short-term against short-term, long-term against long-term — then across categories. If losses still exceed gains, up to $3,000 of net capital loss can be deducted against ordinary income per year ($1,500 if married filing separately), with the remainder carried forward indefinitely. Be aware of the wash sale rule if you plan to buy back in.