Which Server Shifts Actually Pay Best? Work Out Your Effective Hourly Rate
Everyone at your restaurant agrees weekends are better. Almost nobody could tell you by how much, which is why “can you take Monday?” still gets a yes.
Here’s the arithmetic that turns a preference into a number.
Full walkthrough of the template used in this guide.
The Formula
Effective hourly rate = net pay ÷ hours actually worked
where net pay = (hours × cash wage) + cash tips + card tips − tip-out paid.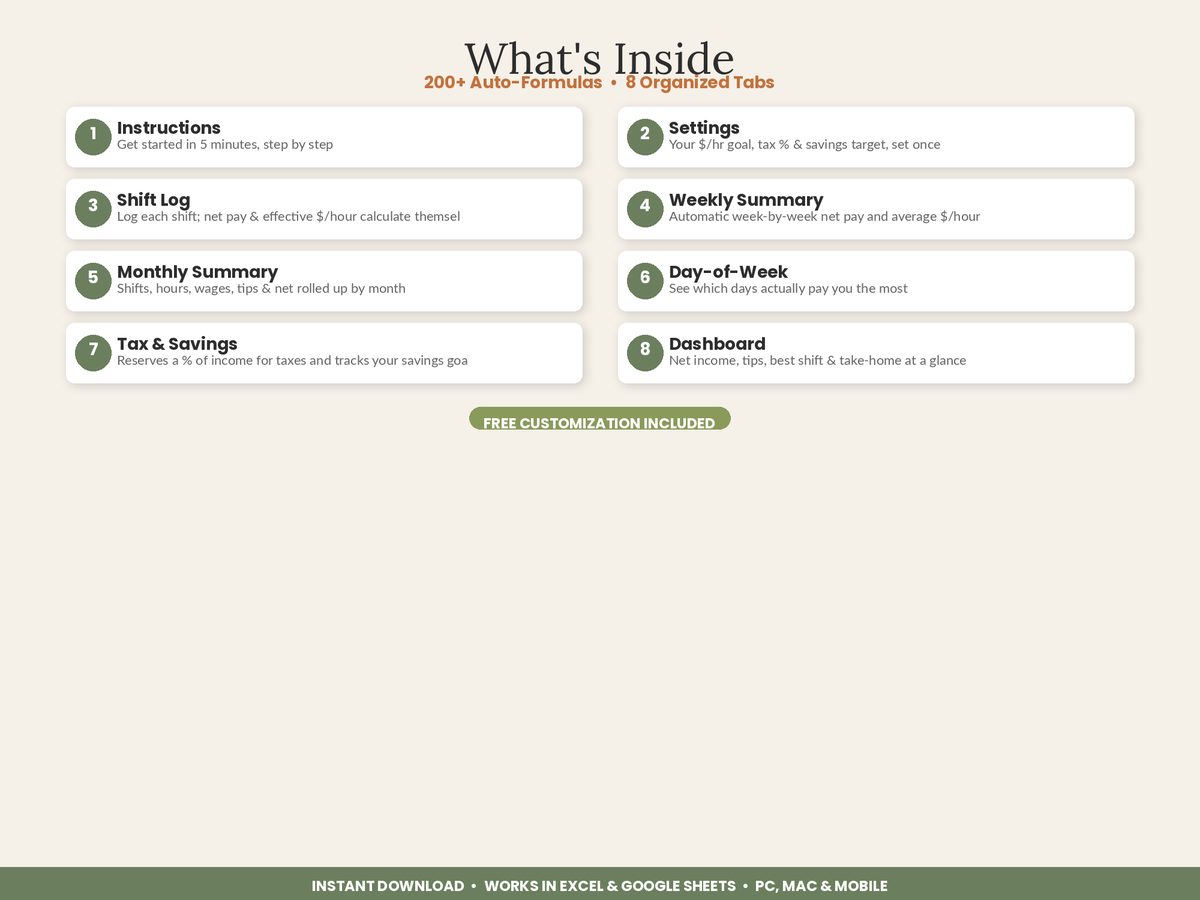
Two parts of that get quietly fudged, and both push the number in the flattering direction. Tip-out gets left out of the top. Side work gets left out of the bottom. Fix both and the picture changes.
A Worked Month
Sixteen shifts across two venues — a server job at Harbor Grill on a $2.13 cash wage, a bartending job at Blue Marlin at $9.00 — from the full shift log in the pillar guide:
| Day | Shifts | Hours | Net pay | Effective $/hr |
|---|---|---|---|---|
| Mon | 2 | 10.0 | $112.30 | $11.23 |
| Tue | 2 | 11.5 | $177.49 | $15.43 |
| Wed | 2 | 12.0 | $190.56 | $15.88 |
| Thu | 2 | 11.5 | $192.49 | $16.74 |
| Fri | 4 | 30.5 | $1,063.50 | $34.87 |
| Sat | 3 | 24.5 | $959.50 | $39.16 |
| Sun | 1 | 6.5 | $125.84 | $19.36 |
Saturday pays 3.5x what Monday pays, per hour.
And the venue split matters even more than the day split:
| Venue | Shifts | Hours | Net pay | Effective $/hr |
|---|---|---|---|---|
| Blue Marlin (bartender, $9.00) | 7 | 55.0 | $2,023.00 | $36.78 |
| Harbor Grill (server, $2.13) | 9 | 51.5 | $798.68 | $15.51 |
Nine shifts at one job earned $798.68. Seven shifts at the other earned $2,023.00. That is more shifts for less than half the money, and it’s the kind of thing that stays invisible for years because both wallets are the same wallet.
The Side-Work Correction
The hours on your schedule are not the hours you worked. Rolling silverware, stocking, cutting fruit, waiting on a table that won’t leave, cashing out — call it 45 minutes before and 30 minutes after, so 1.25 hours per shift.
Apply it to the best and worst shifts of the month:
| Scheduled | Actual | Net pay | $/hr scheduled | $/hr actual | |
|---|---|---|---|---|---|
| Sat Jun 20, Blue Marlin | 8.5 | 9.75 | $334.50 | $39.35 | $34.31 |
| Mon Jun 22, Harbor Grill | 5.0 | 6.25 | $52.65 | $10.53 | $8.42 |
Two things fall out of that table.
Your real rate is roughly 13–20% lower than you think. Not a rounding error — apply the same 1.25 hours to all sixteen shifts and the month’s 106.5 hours becomes 126.5, so $2,821.68 works out at $22.31 an hour, not $26.49.
Unpaid time punishes short shifts hardest. A fixed 1.25 hours is 14.7% of an 8.5-hour shift and 25% of a 5-hour one. So the correction widens the gap: Saturday to Monday goes from 3.5x to 4.1x. The shifts already paying least are the ones losing the most to the correction, which is precisely the opposite of what the “at least it’s something” argument assumes.
Six Ways People Get This Wrong
1. Ranking by total instead of by rate. A nine-hour double produces the biggest number on the page and can still be a below-average hour. Rank by rate to decide what to pick up; look at totals separately to check you’re getting enough hours.
2. Counting cash in pocket. Card tips arrive on a later paycheck and tip-out already left. “I walked with $180” is not net pay and it’s not comparable between a cash-heavy shift and a card-heavy one.
3. Ignoring side work. Covered above. It’s the single biggest distortion.
4. Averaging over too few shifts. Three Saturdays averaged $39.16 an hour. One $150 party would take that sample to $45.29 — a 15.6% move from a single table. Eight or more shifts in a category before you act on it.
5. Forgetting the wage varies. Harbor Grill’s $2.13 versus Blue Marlin’s $9.00 is a $6.87/hour head start before a single tip. Over an 8-hour shift that’s $54.96 of the difference right there, and it has nothing to do with how well you worked.
6. Not counting the commute and the split. A shift 25 minutes away costs you 50 minutes of unpaid life. A split shift with a three-hour hole in it costs you the afternoon. Neither shows up in $/hour, and both are real. If a split shift and a straight shift pay the same rate, they are not the same offer.
Turning It Into a Decision
Once you have eight or so shifts per category, set a minimum acceptable rate and treat it as a filter rather than a mood.
Say the number is $25/hour. Against the worked month:
- Take: Friday and Saturday at Blue Marlin ($34.87 and $39.16)
- Question: Sunday at Harbor Grill ($19.36) — the only weekday-rate shift with weekend-ish traffic, and worth a few more data points
- Trade away: Mon–Thu at Harbor Grill ($11.23–$16.74)
Then the interesting move: one Saturday is worth three-and-a-half Mondays. So swapping a Saturday for two Monday shifts isn’t a favour with a small cost — it’s roughly a 43% pay cut on those hours. The number doesn’t make the decision for you. It just stops you making it by accident.
The same arithmetic answers the bigger question. If Blue Marlin pays $36.78 and Harbor Grill pays $15.51, the real question isn’t which shifts to take at Harbor Grill — it’s whether to ask Blue Marlin for another night. Two extra bar shifts a month at 8 hours each is roughly $588 of net pay, against $248 for the same 16 hours at Harbor Grill.
Set a Target and Colour the Rows
The practical version of all this is one setting: a target $/hour, and every shift shaded against it — green at or above, amber close, red below.
You stop reading a table and start reading a pattern. In the worked month with a $30 target, every Blue Marlin row is green and every Harbor Grill row is red, and that fact arrives in a second rather than after arithmetic. When a shift you assumed was good shows up red three times running, that’s the finding.
Log the next eight shifts with honest hours — clock-in to walk-out, not the schedule — and your first real rate will be waiting. It’s usually a surprise, and usually in the direction that changes what you say yes to. What to do with the income once you can see it, including how much to set aside.
Featured on ReadySheetGo
Server, Bartender & Tipped Worker Income Tracker — $11.99
Every row of the 200-shift log calculates effective $/hour automatically and colour-codes it green / amber / red against the target you set in Settings. The Day-of-Week Analysis tab ranks Mon–Sun by shifts, hours, net pay and real $/hour — the table above, built from your own shifts. Settings holds up to five venues with separate roles and base hourly wages, so a two-job comparison like Harbor Grill versus Blue Marlin comes out of the same file. Weekly and Monthly Summaries show volatility and trend, and the Dashboard returns average effective $/hour and average net per shift alongside totals. Eight tabs, sample data pre-filled. Works in Excel and Google Sheets.
Get the Server, Bartender & Tipped Worker Income Tracker →
Part of the complete guide to tracking tips as a server. The figures above come from one worked month with stated assumptions and are there to show the method — your own rates will differ.
Frequently Asked Questions
How do you calculate your real hourly rate as a server?
Net pay divided by hours actually worked. Net pay is (hours × cash wage) + cash tips + card tips − tip-out paid. Hours actually worked means from when you clocked in to when you walked out, including side work and cash-out — not the hours on the schedule. In a worked June, a Saturday bar shift came to $334.50 over 8.5 scheduled hours, which is $39.35 an hour on paper and $34.31 an hour once 1.25 hours of setup and cash-out are counted.
Are lunch shifts worth it for servers?
Usually not on a per-hour basis, and the gap is bigger than most people assume. In the worked month, Monday shifts averaged $11.23 an hour against Saturday's $39.16 — 3.5x, widening to 4.1x once unpaid side work is included, because a fixed 1.25 hours of setup costs a five-hour shift proportionally far more than an eight-hour one. The case for taking them is access to better shifts, seniority, or hours you genuinely need, not the rate.
How many shifts do you need to log before the average is reliable?
Aim for at least eight shifts in a category before you act on its average, because a single unusual table moves a small sample a long way. Three Saturdays averaging $39.16 an hour would jump to $45.29 — a 15.6% move — on the strength of one $150 party. Eight or more shifts absorbs that. Until then, treat the numbers as a first read rather than a decision.
Should I compare shifts by total earnings or hourly rate?
Hourly rate, then check the total separately. Total earnings reward long shifts, which is why a nine-hour double can feel like the best shift of the week while paying less per hour than a busy six. Rank by rate to decide what to pick up, then look at totals to check you're getting enough hours overall — the two answer different questions and using one for both is the most common tracking mistake.