How to Keep Track of Tips as a Server: The Shift-by-Shift System
You know Saturday was good. You think last Monday was a waste of a night. Somewhere in your bag is $40 in fives and you could not say which shift it came from, and when someone asks what you make, the honest answer is a shrug and a range.
That’s normal, and it costs you three specific things: you can’t tell which shifts are actually worth picking up, you can’t prove your income when a landlord asks, and every April is a guess.
Full walkthrough of the template used in this guide.
The fix is not a budgeting app or a better memory. It is six numbers, written down while you’re cashing out, and a sheet that does the rest.
The Six Numbers, and Why Those Six
Everything a tipped worker needs to know is derivable from six facts about each shift: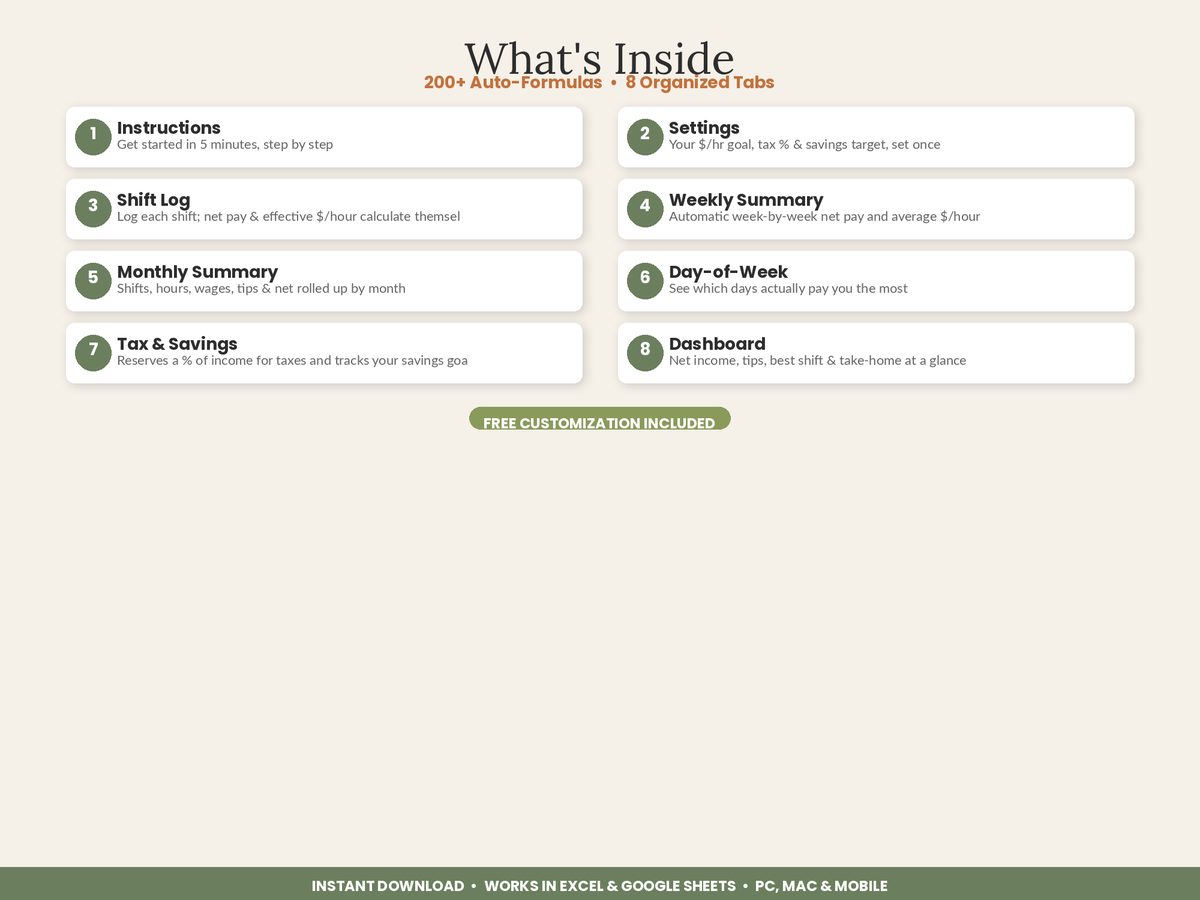
- Date — gives you the day of the week for free, which turns out to be the most valuable column in the sheet.
- Hours worked — the denominator. Without it, tips are a vanity number.
- Cash wage rate — your hourly, which may be $2.13, may be $9, and may differ between two jobs.
- Cash tips — what went in your pocket.
- Card tips — what runs through the POS and onto your W-2.
- Tip-out paid — what you handed to the bar, the barback, the busser or the pool.
From those six, arithmetic produces everything else:
- Net pay = (hours × wage) + cash tips + card tips − tip-out
- Effective $/hour = net pay ÷ hours
- Weekly, monthly and annual totals
- Average by day of week, and by venue
- Reportable tip income and a tax set-aside
Note what is not on the list: table count, covers, sales, weather. Those are interesting and they are also why people quit tracking in week two. Six columns you can fill in twenty seconds survives a bad night. Twelve columns does not.
Log at Cash-Out, Not at Home
This is the whole game. The moment you count out your drawer is the only moment you know your cash tips exactly. An hour later it’s a guess, and a guess with a systematic bias — people round tips up in memory and forget tip-out entirely, which is exactly the combination that makes a slow month feel survivable when it wasn’t.
Two habits make it stick:
- Write the numbers before you leave the building. Phone note, paper, whatever — then transfer to the sheet once a week.
- Never skip a bad shift. The slow Mondays are the data. A log that only contains good nights tells you nothing except that good nights exist.
A Worked June
Here is a real-shaped month for one person working two venues — a server at Harbor Grill in a state that uses the full federal tip credit ($2.13 cash wage), and a bartender at Blue Marlin Bar at $9.00. Sixteen shifts, four weeks.
| Day | Date | Venue | Hrs | Wage | Wages | Cash | Card | Tip-out | Net pay | $/hr |
|---|---|---|---|---|---|---|---|---|---|---|
| Tue | Jun 2 | Harbor Grill | 6.0 | $2.13 | $12.78 | $22 | $78 | $12 | $100.78 | $16.80 |
| Thu | Jun 4 | Harbor Grill | 5.5 | $2.13 | $11.71 | $18 | $66 | $10 | $85.71 | $15.58 |
| Fri | Jun 5 | Blue Marlin | 7.5 | $9.00 | $67.50 | $65 | $148 | $24 | $256.50 | $34.20 |
| Sat | Jun 6 | Blue Marlin | 8.0 | $9.00 | $72.00 | $80 | $186 | $30 | $308.00 | $38.50 |
| Mon | Jun 8 | Harbor Grill | 5.0 | $2.13 | $10.65 | $12 | $44 | $7 | $59.65 | $11.93 |
| Wed | Jun 10 | Harbor Grill | 6.0 | $2.13 | $12.78 | $20 | $71 | $11 | $92.78 | $15.46 |
| Fri | Jun 12 | Blue Marlin | 7.5 | $9.00 | $67.50 | $58 | $162 | $26 | $261.50 | $34.87 |
| Sun | Jun 14 | Harbor Grill | 6.5 | $2.13 | $13.84 | $30 | $96 | $14 | $125.84 | $19.36 |
| Tue | Jun 16 | Harbor Grill | 5.5 | $2.13 | $11.71 | $16 | $58 | $9 | $76.71 | $13.95 |
| Thu | Jun 18 | Harbor Grill | 6.0 | $2.13 | $12.78 | $24 | $82 | $12 | $106.78 | $17.80 |
| Fri | Jun 19 | Blue Marlin | 8.0 | $9.00 | $72.00 | $72 | $170 | $28 | $286.00 | $35.75 |
| Sat | Jun 20 | Blue Marlin | 8.5 | $9.00 | $76.50 | $88 | $204 | $34 | $334.50 | $39.35 |
| Mon | Jun 22 | Harbor Grill | 5.0 | $2.13 | $10.65 | $10 | $38 | $6 | $52.65 | $10.53 |
| Wed | Jun 24 | Harbor Grill | 6.0 | $2.13 | $12.78 | $22 | $74 | $11 | $97.78 | $16.30 |
| Fri | Jun 26 | Blue Marlin | 7.5 | $9.00 | $67.50 | $62 | $155 | $25 | $259.50 | $34.60 |
| Sat | Jun 27 | Blue Marlin | 8.0 | $9.00 | $72.00 | $84 | $192 | $31 | $317.00 | $39.62 |
| Total | 106.5 | $604.68 | $683 | $1,824 | $290 | $2,821.68 | $26.49 |
Sixteen shifts. 106.5 hours. $2,821.68 net, an effective $26.49 an hour.
Now read what the totals say — because these are the readings you cannot get from a shrug and a range.
Your wages are 21.4% of your income
Wages: $604.68 — 21.4% of the total. Tips kept after tip-out: $2,217, or 78.6% of everything.
This is the single most important structural fact about a tipped job, and it drives almost every practical decision downstream. Your paycheck is not your income — it’s a rounding error attached to your income. Which means the payroll system your employer runs is only tracking a fifth of what you earn, and every institution that asks about your money (landlord, lender, tax preparer) is going to look at the wrong fifth unless you hand them something better.
Tip-out is 11.6% of your gross tips
Gross tips $2,507, tip-out $290. That ratio is worth writing down once and then watching, because tip-out structures change quietly — a new barback, a shift to percentage-of-sales instead of percentage-of-tips — and a percentage point of drift is real money. If you only ever recorded net tips, you’d have no idea it moved. How tip-out and tip pools differ, and how to see what each is costing you.
One venue pays 2.4x the other
| Venue | Shifts | Hours | Net pay | Effective $/hr |
|---|---|---|---|---|
| Blue Marlin (bar) | 7 | 55.0 | $2,023.00 | $36.78 |
| Harbor Grill (server) | 9 | 51.5 | $798.68 | $15.51 |
Nine shifts at Harbor Grill produced $798.68. Seven shifts at Blue Marlin produced $2,023.00. That’s more shifts for less than half the money — and it’s completely invisible without the sheet, because Harbor Grill shifts feel busy and the money arrives in the same wallet.
Days are not equal, and not in the way people assume
| Day | Shifts | Net pay | Effective $/hr |
|---|---|---|---|
| Mon | 2 | $112.30 | $11.23 |
| Tue | 2 | $177.49 | $15.43 |
| Wed | 2 | $190.56 | $15.88 |
| Thu | 2 | $192.49 | $16.74 |
| Fri | 4 | $1,063.50 | $34.87 |
| Sat | 3 | $959.50 | $39.16 |
| Sun | 1 | $125.84 | $19.36 |
Saturday pays 3.5x what Monday pays, per hour. Everyone at the restaurant knows Saturday is better; almost nobody knows it’s 3.5x. That’s the difference between “I prefer weekends” and “one Saturday is worth three Mondays, so trading a Saturday off for two Mondays is a pay cut.” Working out which shifts actually pay best, and the trap in comparing a busy shift to a long one.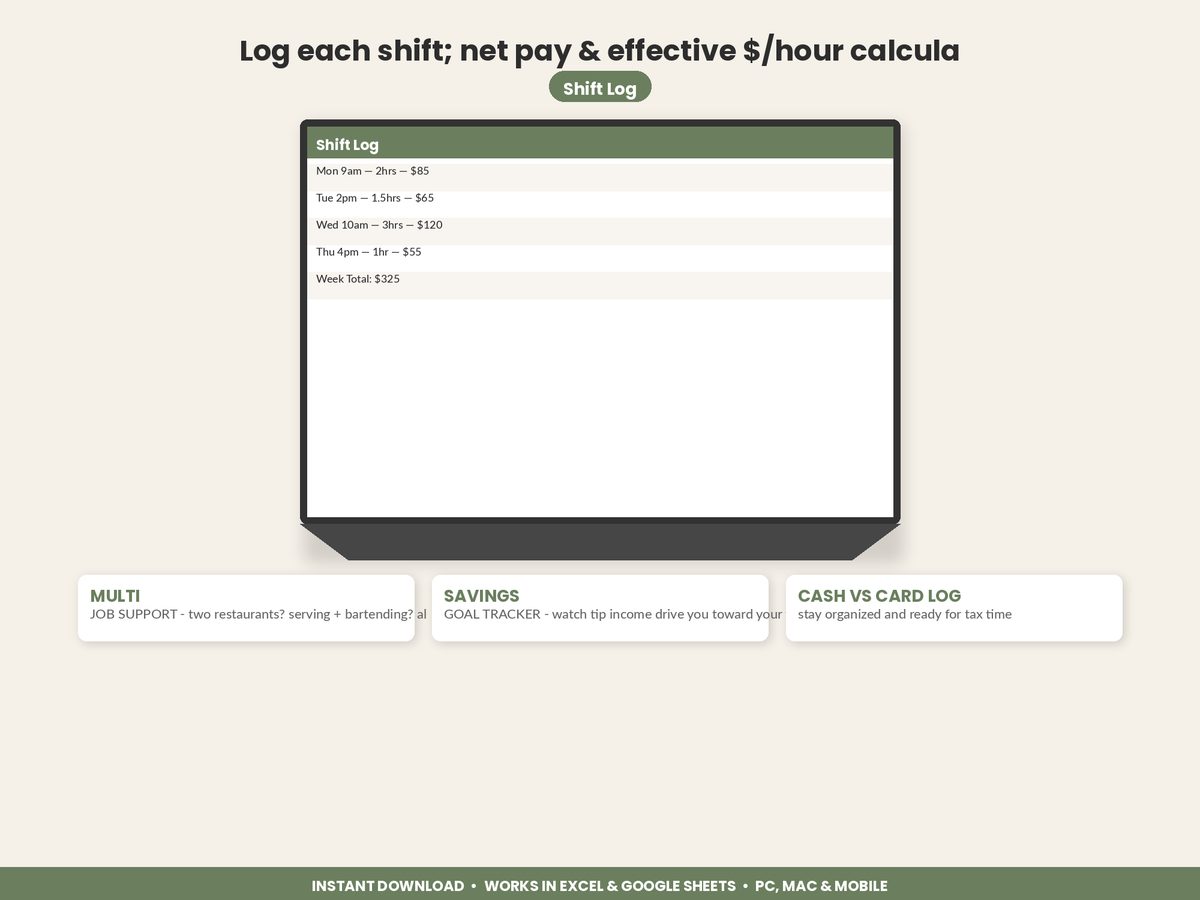
Weeks vary more than you feel
| Week | Shifts | Hours | Net pay | $/hr |
|---|---|---|---|---|
| Jun 1–7 | 4 | 27.0 | $750.99 | $27.81 |
| Jun 8–14 | 4 | 25.0 | $539.77 | $21.59 |
| Jun 15–21 | 4 | 28.0 | $803.99 | $28.71 |
| Jun 22–28 | 4 | 26.5 | $726.93 | $27.43 |
Same number of shifts every week, and week 2 came in $264 below week 3. Not because of hours — 25 versus 28 — but because week 2 had two weekday server shifts where week 3 had a Friday and a Saturday behind the bar.
That $264 swing on an identical-looking schedule is why “budget on your average” fails for tipped workers and why the weekly view matters. Your rent is fixed at one number; your income arrives as a distribution. The practical move is to budget on something near your worst recent week rather than your average, and treat the gap as the buffer that carries you through January.
What the Totals Are Actually For
Four jobs, in order of how often they matter:
1. Deciding which shifts to take. The effective-hourly table is the whole answer. Once you know Saturday behind the bar is $39/hour and Monday on the floor is $11, “can you cover Monday” stops being a favour and starts being a number.
2. Setting money aside for tax. Your card tips are on your W-2. Your cash tips are only reported if you report them — and the IRS rule is that if you receive $20 or more in tips in a month from one employer, you must report them to that employer in a written statement by the 10th of the following month (IRS tip recordkeeping and reporting). A shift log is that record. How much to actually set aside, with 2026 numbers.
3. Proving income. $2,821.68 a month annualises to roughly $33,860 — but the pay stub from Harbor Grill shows $109.68 of gross wages for the month. Guess which one a leasing office asks for. What to hand a landlord or lender instead.
4. Checking your employer’s arithmetic. If your employer takes a tip credit, the FLSA requires that your cash wage plus tips reach at least the full federal minimum wage of $7.25 an hour in each workweek, and the employer must make up any shortfall. The maximum tip credit is $5.12 ($7.25 − $2.13) (DOL Fact Sheet #15). Your own log is the only way to run that check yourself. In the worked month, Harbor Grill’s slowest week came to $150.43 over 11.0 hours — $13.68 an hour, comfortably clear — but a genuinely dead week is exactly when nobody is checking.
Building It: Two Tabs and a Dashboard
You do not need eight tabs to start. You need:
A Settings tab holding the things that repeat — your venues, your roles, your cash wage at each, your target $/hour, your tax set-aside rate. Enter them once so the log becomes dropdowns instead of typing.
A Shift Log with the six input columns and four calculated ones. The calculated columns should be formulas, not typed values, so a corrected tip-out fixes every total at once.
A Dashboard that reads the log and returns: net income to date, total tips, shifts, hours, average effective $/hour, average net per shift, and your tax reserve.
Then, when the log has a few months in it, three views that turn data into decisions: by week (volatility), by month (trend and seasonality), and by day of week (the scheduling answer).
A useful touch: set a target $/hour in Settings and colour each shift against it — green at or above, amber near, red below. In the worked month, with a $30 target, every Blue Marlin shift is green and every Harbor Grill shift is red. That’s not a judgement about the restaurant; it’s a fact about where your hours should go.
Start With Four Shifts
Not a year. Not even a month. Log your next four shifts — two you expect to be good and two you expect to be slow — with hours, cash, card and tip-out.
Four rows is enough to produce your first effective hourly rate, and that number is almost always a surprise in one direction or the other. If it’s higher than you thought, you’ve been underestimating yourself to landlords and to yourself. If it’s lower, you’ve just found out that the busy shifts aren’t the paying ones.
Either way you now have something a shrug can’t give you.
Featured on ReadySheetGo
Server, Bartender & Tipped Worker Income Tracker — $11.99
Eight tabs, built exactly as above. A Settings tab holds up to five venues with their roles and base hourly wages, your tracking year, your target $/hour and your tax set-aside rate. The Shift Log takes 200 shifts with venue and role dropdowns, auto-fills the day of the week from the date, and calculates wages, net pay and effective $/hour on every row, colour-coded green / amber / red against your target. Weekly Summary and Monthly Summary build themselves from the log. A Day-of-Week Analysis ranks Mon–Sun by real $/hour. A Tax & Savings tab applies your set-aside rate to year-to-date net income and tracks an annual savings goal with a % to goal. The Income Dashboard returns total net income, total tips, shifts, hours, average effective $/hour, average net per shift, taxes to reserve and estimated take-home.
Sample data is pre-filled so you can see it working — type over it with your own. Works in Excel and Google Sheets.
Get the Server, Bartender & Tipped Worker Income Tracker →
This is general information, not tax or legal advice. Tip reporting and wage rules vary by state and by employer, so confirm your own with a qualified professional.
Sources: IRS Tip recordkeeping and reporting · DOL Fact Sheet #15: Tipped Employees Under the FLSA
Frequently Asked Questions
What should a server track after every shift?
Six things: date, hours worked, your cash wage rate, cash tips, card tips, and tip-out paid. Everything else — net pay, effective hourly rate, weekly and monthly totals, which days pay best, and your tax set-aside — is arithmetic on those six numbers. Logging them takes about twenty seconds while you cash out, and it is the only moment you will ever know them accurately.
Do I need to track cash tips and card tips separately?
Yes, for two reasons. Card tips already reach your employer's payroll system and appear on your W-2, while cash tips only get reported if you report them — so the split tells you what your own record has to cover. It also tells you something useful about your section: a rising card share means your reported income is rising whether you like it or not, and a heavy cash share means more of your income is arriving untaxed and needs to be set aside deliberately.
Should I log tips before or after tip-out?
Log both. Record gross cash tips and gross card tips as you received them, then record tip-out paid as its own column, and let the sheet subtract. Recording only the net figure destroys the one number that tells you whether your house's tip-out is reasonable — in the worked month below, tip-out is $290, which is 11.6% of $2,507 in gross tips. You cannot notice that percentage drifting up if you never wrote gross down.
Is a spreadsheet better than a tip tracking app for servers?
For a tipped worker, a spreadsheet has one decisive advantage: you own the file. Landlords, lenders and tax preparers accept a dated, complete log you can print or export; most apps hand you a screenshot. A spreadsheet also lets you add the column your house actually uses — banquet gratuity, barback tip-out, a second venue at a different wage — where an app gives you whatever fields it shipped with. The trade is that you have to open it, which is why logging at cash-out rather than at home matters more than the tool.