Cleaning Business Spreadsheet: Track Clients, Jobs and Profit
You know roughly what came in this month. You know you bought supplies twice. Somewhere there is a note with the Rivera lockbox code, and you are fairly sure two clients have not paid yet — but you would have to scroll back through your messages to say which.
That is how most cleaning businesses are run, and it works right up until it doesn’t. Usually the breaking point is one of three questions you can’t answer: Should I raise my rates? Can I afford to hire? Am I actually making more than I did last year?
All three need the same thing — numbers that already exist, in one place, doing arithmetic on themselves. Here is what to track, why each piece matters, and a full worked month you can compare your own against.
The Eight Numbers a Cleaning Business Runs On
Not revenue. Revenue is the number that feels like progress and tells you the least.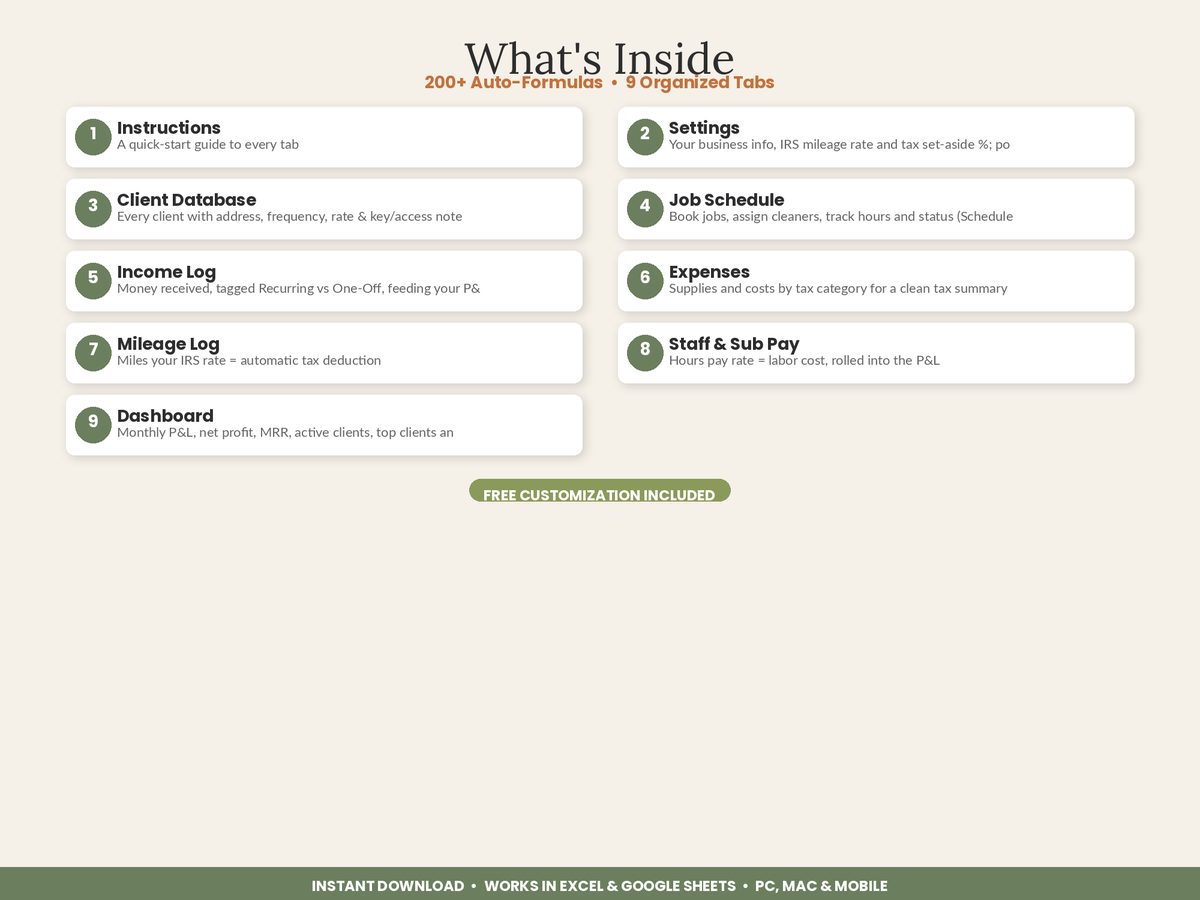
- Recurring monthly revenue (MRR) — what your regular clients are contractually worth each month, before you clean a thing.
- Active client count — how many are currently live, not how many you’ve ever had.
- Revenue per month — everything actually collected.
- Supplies and overhead — the cash costs of operating.
- Labour cost — what you paid staff or subs.
- Business mileage — the deduction most cleaners lose entirely.
- Net profit and margin % — what’s left, and whether it’s improving.
- Tax set-aside — the portion of that profit that was never yours.
Six of those eight can be calculated automatically if you log the raw events — jobs, payments, receipts, miles — as they happen. That is the entire case for a spreadsheet: you record facts once, and it produces the numbers.
The Sheets That Produce Them
Client Database — the one people skip
A client list with names and addresses is a contact list. A client database has four extra columns that turn it into a forecasting tool: frequency, rate per visit, active?, and access notes.
Frequency and rate together give you each client’s monthly value. The conversion is the part people get wrong:
| Frequency | Visits per month |
|---|---|
| Weekly | 4.33 |
| Biweekly | 2.17 |
| Monthly | 1 |
| One-off | 0 |
It’s 4.33, not 4. A year has 52 weeks, and 52 ÷ 12 = 4.33. Using 4 understates a weekly client by roughly 8% — on a book of ten weekly clients that is a month of revenue you didn’t know you had.
So a $120 weekly client is worth $519.60 a month. Here’s a real book of business:
| Client | Frequency | Rate | Monthly value |
|---|---|---|---|
| Johnson Family | Weekly | $120 | $519.60 |
| Downtown Dental | Weekly | $200 | $866.00 |
| Cedar Airbnb | Weekly | $95 | $411.35 |
| Rivera Household | Biweekly | $150 | $325.50 |
| Patel Residence | Monthly | $180 | $180.00 |
| Total MRR | $2,302.45 |
That $2,302.45 is the most valuable number in the business. It is what arrives whether or not you sell anything new this month. Every one-off job is upside on top of it — and a one-off, by definition, contributes zero to it, which is exactly why a book full of move-out cleans feels busier and pays worse than a book full of biweeklies.
The access notes column earns its place the first time someone else covers a job for you.
Job Schedule — hours, not just dates
Log date, client, service type, who cleaned it, hours, price, status. Two of those do heavy lifting.
Hours is what lets you convert a flat price into an effective hourly rate, which is the only way to compare a $95 turnover against a $350 move-out honestly. Status — Scheduled → Done → Paid — is your accounts receivable. Every job sitting on “Done” is money you have earned and not been given.
Income Log — tag recurring vs one-off
Same as any income log with one addition: a Type column marked Recurring or One-Off.
Without that tag, a good month and a fragile month look identical. $2,490 made up of $2,140 recurring and one $350 move-out is a stable business. The same $2,490 made up of $600 recurring and five one-offs is a business that starts every month at zero.
Expenses — categorised for tax, not for you
Categorise as your tax return wants it: Supplies, Equipment, Insurance, Marketing, Vehicle/Fuel, Software, Licences/Permits, Other. Categorising by tax line means your year-end summary is a filing document rather than a project.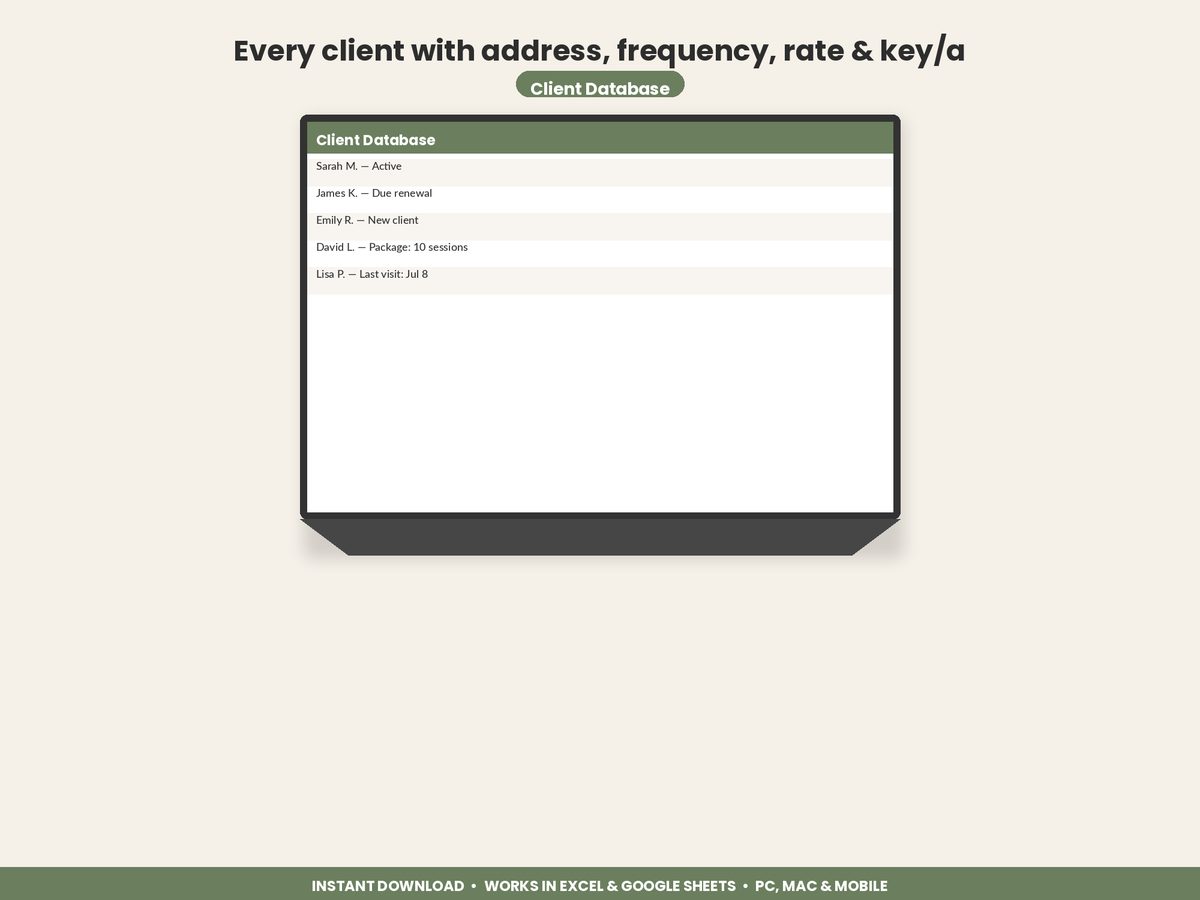
Mileage Log — the deduction cleaners lose
Cleaners drive constantly between jobs and most never log it. Miles × the IRS standard mileage rate is a deduction that requires nothing but a record. The rate changes — and 2026 is unusual in having two, 72.5 cents for January through June and 76 cents from July onward. The full mileage and deductions breakdown is here.
Staff & Sub Pay — hours × rate
Log date, worker, hours and pay rate. This feeds labour cost into your P&L, which is the number that decides whether hiring made you money or just made you busy.
Dashboard — where it all lands
Everything above exists to produce one monthly table: revenue, minus supplies, minus labour, minus mileage, equals net profit, plus margin % and tax set-aside.
A Worked Month
Solo owner, one part-time cleaner, June. Assumptions are stated so you can swap yours in.
Revenue
| Source | Detail | Amount |
|---|---|---|
| Johnson Family | 4 × $120 weekly | $480 |
| Downtown Dental | 4 × $200 weekly | $800 |
| Cedar Airbnb | 4 × $95 weekly | $380 |
| Rivera Household | 2 × $150 biweekly | $300 |
| Patel Residence | 1 × $180 monthly | $180 |
| Move-out: 14 Elm | one-off | $350 |
| Total | $2,490 |
Recurring: $2,140. One-off: $350. A healthy split.
Costs
| Line | Detail | Amount |
|---|---|---|
| Supplies | Restock $84.50 + cloths $32 | $116.50 |
| Equipment | Vacuum bags, filters | $45.00 |
| Insurance | Liability, monthly | $62.00 |
| Marketing | Facebook ads | $40.00 |
| Supplies & overhead | $263.50 | |
| Labour | Maria, 14 hrs × $22 | $308.00 |
| Mileage | 150 business miles × $0.76 | $114.00 |
Result
| Revenue | $2,490.00 |
| − Supplies & overhead | $263.50 |
| − Labour | $308.00 |
| − Mileage | $114.00 |
| Net profit | $1,804.50 |
| Margin | 72.5% |
| Tax set-aside @ 25% | $451.13 |
| Yours to keep | $1,353.37 |
One clarification worth making, because it trips people up: the mileage line is a deduction figure, not a cheque you wrote. The IRS standard rate is designed to approximate the whole cost of running a vehicle — fuel, tyres, maintenance, depreciation — so subtracting it gives you a profit number that already accounts for the wear you’re putting on your car but haven’t paid for yet. It is simultaneously your tax deduction and a fair estimate of a real cost. Your bank balance will look slightly better than $1,804.50; your car is quietly making up the difference.
The 25% set-aside is a placeholder, not advice — self-employment tax alone is 15.3% before any income tax, and your correct percentage depends on your total household situation.
Reading the Result
The margin is the number to watch, not the profit. 72.5% is a solo-operator margin — it is that high because the owner’s own labour costs nothing in cash. Hand more hours to Maria and revenue may rise while margin falls, and that trade is only worth making if the freed-up hours go into selling work rather than disappearing.
Three checks each month:
- Is MRR growing? Revenue can rise on one-offs while your recurring base shrinks. That’s a business getting more fragile while looking like it’s getting bigger.
- Is margin holding? A falling margin on rising revenue means you’re buying growth.
- Is anything stuck on “Done”? That’s your own money sitting in someone else’s account.
There’s a fourth reading worth taking quarterly: recurring revenue as a share of total. In the worked month it’s $2,140 of $2,490, or 86%. That ratio is a stability score. A book above roughly 80% recurring starts each month already mostly full, which means slow weeks are survivable and you can plan around a known number. Below about 50%, you are effectively re-selling the business every month — the revenue may be identical, but the work required to produce it is far higher, and a single bad month has nowhere to fall back to. If the ratio is drifting down while revenue climbs, the growth is coming from one-offs, and the fix is converting your best occasional clients onto a schedule rather than chasing more of them.
Where the Numbers Take You
Once the sheet is running, the three questions from the top become arithmetic:
Should I raise my rates? Divide price by hours including drive time, and compare against what you’d accept per hour. How to price hourly versus flat rate, with a floor-price formula.
How much more do I need? Work backwards from a revenue target through MRR per client. How many clients it actually takes to hit $5,000 a month.
Can I afford to hire? Compare the fully loaded cost of an hour against the margin an hour produces. When to hire your first cleaner, and employee versus subcontractor.
What can I write off? Mileage, supplies, insurance and the rest. The deductions cleaners miss, with the 2026 split mileage rate.
Start With One Month
You don’t need a year of history. Build the client database first — it takes twenty minutes and hands you your MRR immediately, which is usually a bigger number than people expect. Then log a single month of jobs, income, receipts and miles. One complete month tells you your margin, and your margin tells you what to fix.
Featured on ReadySheetGo
Cleaning Business Income & Client Tracker — $14.99
Nine tabs, built exactly as above. A Settings tab holds your mileage rate, tax set-aside % and labour rate and drives every calculation. The Client Database converts frequency and rate into each client’s monthly value automatically. Job Schedule tracks Scheduled → Done → Paid. Income Log tags recurring versus one-off. Expenses are categorised for tax. The Mileage Log converts trips to deductions at your rate. Staff & Sub Pay turns hours into labour cost. The Dashboard returns YTD revenue, net profit, MRR, active clients, mileage deduction, tax set-aside and a month-by-month P&L with margin %.
Sample data is pre-filled so you can see it working — type over it with your own. Works in Excel and Google Sheets.
Get the Cleaning Business Income & Client Tracker →
Frequently Asked Questions
What should a cleaning business spreadsheet track?
Eight things, in this order: a client database with each client's frequency and rate, a job schedule with hours and paid status, an income log tagged recurring versus one-off, expenses by tax category, business mileage, staff and subcontractor hours, and a dashboard that turns all of it into monthly net profit and margin. The client database is the one most solo cleaners skip, and it is the one that produces your recurring monthly revenue figure.
How do I calculate monthly recurring revenue for a cleaning business?
Multiply each client's rate per visit by their visits per month, then add them up. Visits per month is 4.33 for weekly, 2.17 for biweekly and 1 for monthly — 4.33 rather than 4 because a year has 52 weeks, not 48. A $120 weekly client is worth $519.60 a month, not $480, and using 4 instead of 4.33 understates your recurring revenue by about 8%.
What is a good profit margin for a cleaning business?
A solo cleaner with light overhead can run a high margin because labour is their own time rather than a cash cost — the worked month in this guide comes to 72.5%. That figure drops sharply as you add staff, because every hour you hand to an employee converts free owner-labour into paid labour. The margin number that matters is your own, tracked monthly, because the trend tells you whether growth is actually making you money.
Do I need accounting software or is a spreadsheet enough for a cleaning business?
For a solo cleaner or a small crew, a spreadsheet handles it — you need a client list, a job log, income, expenses, mileage and a profit summary, all of which a spreadsheet does without a monthly fee. Accounting software earns its cost when you have payroll to run, employees to file for, or an accountant who wants direct access. Many cleaners run a spreadsheet for years and hand a tax summary to a preparer once annually.